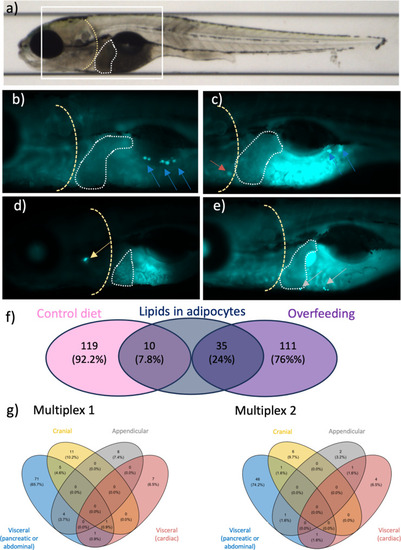
Lipid deposits observed in several anatomical regions in 10-day-old zebrafish larvae. a) Whole-body bright field image of a zebrafish larva in lateral orientation. The white rectangular box indicates the location of magnified images in the lower panel; the white dotted line depicts the liver area and the yellow dashed line indicates the edge of the operculum. b-e) Fluorescence microscopy images at 10x magnification of 10-day-old, Tg:2.8fabp10a:GFP positive zebrafish larvae illustrating the location of dye-stained lipid droplets (highlighted by arrows). The majority of the lipids were stored in the visceral region (abdominal or pancreatic, blue arrow; cardiac, red arrow), followed by the cranial region (yellow arrow), and the appendicular region (grey arrow). f) Results from inspection of 275 10-day-old imaged larvae raised under normal feeding conditions (n = 129) or overfed three-times more (n = 146) for the presence of lipids in adipocytes. Percentages are shown in parenthesis. g) In Multiplexes 1 (left) and 2 (right), a total of 108 (28%) and 62 (16%) larvae had quantifiable lipid deposits in at least one anatomical region, respectively. Most lipids were stored in the abdominal region, followed by the opercular region.
|
