
- Title
-
Functionally characterizing obesity-susceptibility genes using CRISPR/Cas9, in vivo imaging and deep learning
- Authors
- Mazzaferro, E., Mujica, E., Zhang, H., Emmanouilidou, A., Jenseit, A., Evcimen, B., Metzendorf, C., Dethlefsen, O., Loos, R.J., Vienberg, S.G., Larsson, A., Allalou, A., den Hoed, M.
- Source
- Full text @ Sci. Rep.
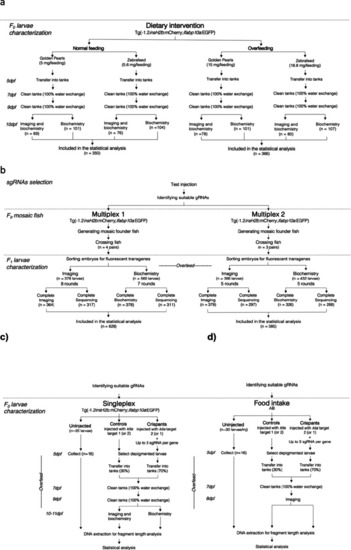
Experimental flow chart. The flow chart describes the workflow, exclusion criteria, and the final number of larvae included in the statistical analysis in all experiments. |
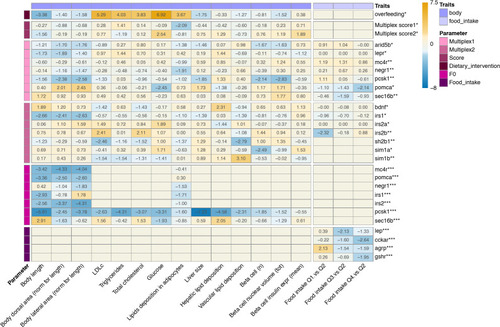
Heatmap visualizing the effects of all genetic and dietary perturbations on obesity-related traits in zebrafish larvae. Numbers in cells are effects of exposure vs. controls expressed in z-scores, so values <−1.96 and > 1.96 reflect effects with |
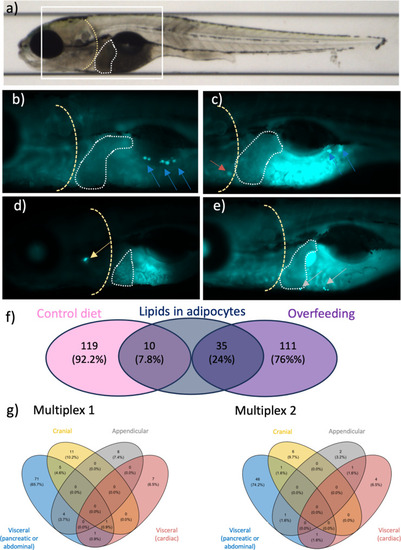
Lipid deposits observed in several anatomical regions in 10-day-old zebrafish larvae. |
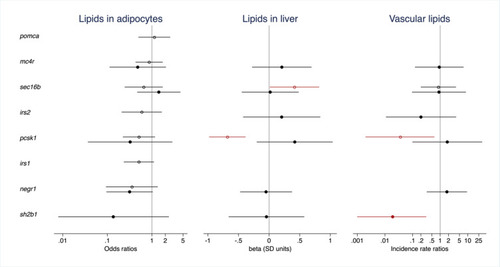
The effect of CRISPR/Cas9-induced mutations on lipid deposition in adipocytes and ectopic regions in 10-day-old zebrafish larvae. Results are shown for genes with data from (1) a comparison of CRISPR/Cas9 edited founders (F0 generation) for all zebrafish orthologues of a human gene vs. sibling controls (open circles) and/or (2) from a comparison of offspring from an in-cross of CRISPR/Cas9 founders (F1 generation) with frameshift and/or premature stop codon introducing mutations vs. larvae free from CRISPR/Cas9-induced mutations in the gene (filled circles). Dots and error bars show odds ratios (logistic regression, for lipid deposition in adipocytes, left), effect sizes expressed in standard deviation units (linear regression, for hepatic lipid deposition, middle), and incident rate ratios (negative binomial regression, for vascular lipid deposition, right) and their 95% confidence intervals. In the F0 experiment, effects are adjusted for batch, tank and time of day at imaging. In the F1 experiment, effects are adjusted for multiplex (1 or 2), batch, time of day at imaging, and the number of mutated alleles in the remaining CRISPR/Cas9-targeted genes weighted by the predicted effect of such mutations on protein function (synonymous 0.33, missense 0.66, frameshift and/or premature stop codon introducing 1.00). Effects with |
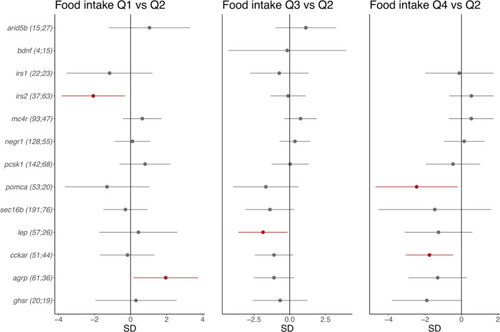
The effect of CRISPR/Cas9-induced mutations in 13 obesity genes on food intake in 8-day-old CRISPR/Cas9 founders. Dots and error bars show effect sizes and 95% confidence intervals for affected larvae (number on the left) vs. controls (number on the right). The effect of being in the first quartile of food intake [Q1]; left); the effect of being in the third quartile (Q3; middle); the effect of being in the top quartile (Q4; right). All are compared with the second quartile (Q2) as a reference. The results for |