
Fig. 1
- ID
- ZDB-FIG-241230-6
- Publication
- Saha et al., 2024 - Rab11-Rab8 cascade dynamics in primary cilia and membrane tubules
- Other Figures
- All Figure Page
- Back to All Figure Page
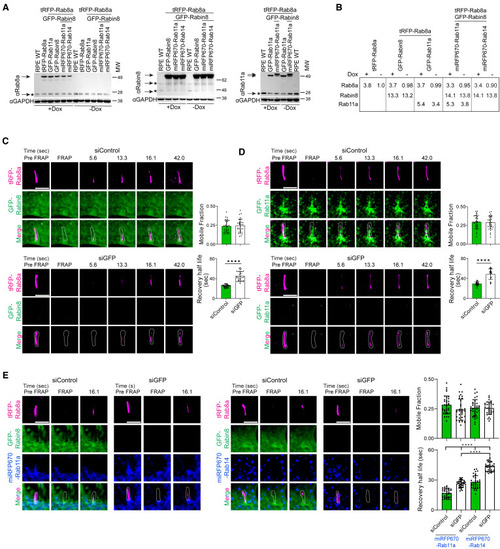
Rab8 ciliary trafficking is promoted by Rabin8 and Rab11 (A) Immunoblot analysis comparing lysates from RPE WT, tRFP-Rab8a, tRFP-Rab8a+GFP-Rab11a, tRFP-Rab8a+GFP-Rabin8, tRFP-Rab8a+GFP-Rabin8+miRFP-Rab11a, tRFP-Rab8a+GFP-Rabin8+miRFP-Rab14 cells ± Dox probed with Rab8a antibody; RPE WT, tRFP-Rab8a+GFP-Rabin8, tRFP-Rab8a+GFP-Rabin8+miRFP-Rab11a, tRFP-Rab8a+GFP-Rabin8+miRFP-Rab14, cells ± Dox probed with Rabin8 antibody; and RPE WT, tRFP-Rab8a+GFP-Rab11a, tRFP-Rab8a+GFP-Rabin8+miRFP-Rab11a cells ± Dox and probed with Rab11a antibody. Glyceraldehyde 3-phosphate dehydrogenase (GAPDH) antibody was used as a loading control. ∗ corresponds to the endogenous protein detected in RPE WT cells and the arrows indicates the endogenous and exogenous levels in established fluorescent-tagged RPE cells. (B) Table showing densitometry of Rab11a, Rab8a, and Rabin8 proteins corresponding to arrows in (A) in ±Dox-treated cell lines compared to endogenous proteins in RPE WT cells corresponding to ∗ in (A). Total Rab11a, Rab8a, and Rabin8 expression was normalized to GAPDH levels. (C–E) FRAP studies of ciliary tRFP-Rab8 in cells, treated with Dox for 24 h, with and without exogenous Rab11, Rabin8, and/or Rab14. Representative images of FRAP analysis performed on cilia (∼5 μm) in cells treated with siControl or siGFP for 72 h, with the last 12 h serum starved to induce ciliation. Plots show the quantification of mobile fraction and half-life for the recovery of tRFP-Rab8a. (C) RPE tRFP-Rab8a+GFP-Rabin8 cells. (D) RPE tRFP-Rab8a+GFP-Rab11a cells. (E) RPE tRFP-Rab8a+GFP-Rabin8+miRFP670-Rab11a/miRFP670-Rab14 cells. Representative images from 10 cells analyzed and plots show mean ± SD from n = 3 experiments. ∗∗∗∗p < 0.00001. Scale bar: 5 μm. |