
- Title
-
Rab11-Rab8 cascade dynamics in primary cilia and membrane tubules
- Authors
- Saha, I., Insinna, C., Westlake, C.J.
- Source
- Full text @ Cell Rep.
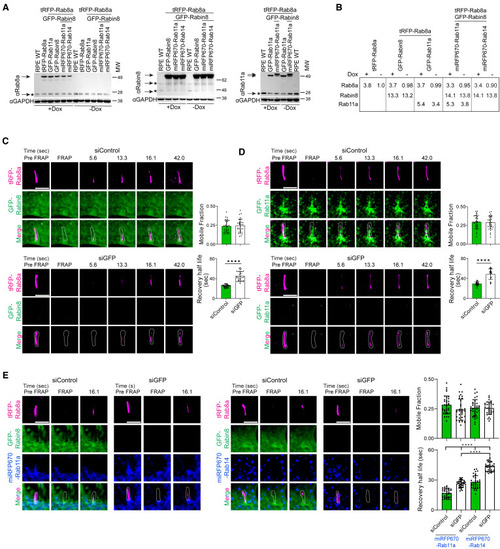
Rab8 ciliary trafficking is promoted by Rabin8 and Rab11 (A) Immunoblot analysis comparing lysates from RPE WT, tRFP-Rab8a, tRFP-Rab8a+GFP-Rab11a, tRFP-Rab8a+GFP-Rabin8, tRFP-Rab8a+GFP-Rabin8+miRFP-Rab11a, tRFP-Rab8a+GFP-Rabin8+miRFP-Rab14 cells ± Dox probed with Rab8a antibody; RPE WT, tRFP-Rab8a+GFP-Rabin8, tRFP-Rab8a+GFP-Rabin8+miRFP-Rab11a, tRFP-Rab8a+GFP-Rabin8+miRFP-Rab14, cells ± Dox probed with Rabin8 antibody; and RPE WT, tRFP-Rab8a+GFP-Rab11a, tRFP-Rab8a+GFP-Rabin8+miRFP-Rab11a cells ± Dox and probed with Rab11a antibody. Glyceraldehyde 3-phosphate dehydrogenase (GAPDH) antibody was used as a loading control. ∗ corresponds to the endogenous protein detected in RPE WT cells and the arrows indicates the endogenous and exogenous levels in established fluorescent-tagged RPE cells. (B) Table showing densitometry of Rab11a, Rab8a, and Rabin8 proteins corresponding to arrows in (A) in ±Dox-treated cell lines compared to endogenous proteins in RPE WT cells corresponding to ∗ in (A). Total Rab11a, Rab8a, and Rabin8 expression was normalized to GAPDH levels. (C–E) FRAP studies of ciliary tRFP-Rab8 in cells, treated with Dox for 24 h, with and without exogenous Rab11, Rabin8, and/or Rab14. Representative images of FRAP analysis performed on cilia (∼5 μm) in cells treated with siControl or siGFP for 72 h, with the last 12 h serum starved to induce ciliation. Plots show the quantification of mobile fraction and half-life for the recovery of tRFP-Rab8a. (C) RPE tRFP-Rab8a+GFP-Rabin8 cells. (D) RPE tRFP-Rab8a+GFP-Rab11a cells. (E) RPE tRFP-Rab8a+GFP-Rabin8+miRFP670-Rab11a/miRFP670-Rab14 cells. Representative images from 10 cells analyzed and plots show mean ± SD from n = 3 experiments. ∗∗∗∗p < 0.00001. Scale bar: 5 μm. |

The Rab11-Rab8 cascade promotes Rab11 ciliary accumulation (A and B) Quantification of Rab8 effects on Rab11 ciliary localization. (A) Representative images of cilia in RPE (left) and RPE GFP-Rab8a (center) cells transiently transfected with tRFP-Rab WT and constitutively active (QL) proteins. (Right) Quantification of ciliary localization of tRFP-Rabs from cells starved for the last 12 h and stained with acetylated α-tubulin (AcTub) antibody showing mean ± SEM from >80 cells from n = 3 experiments. (B) RPE tRFP-Rab8a+GFP-Rab11a cells were treated with siControl and sitRFP for 72 h and Dox for 24 h. (Left) Immunoblot probed with tRFP, Rab11a, and actin antibodies. (Center and right) Cells were serum starved the last 12 h and stained with AcTub antibodies. GFP-Rab11a ciliary localization was detected by spinning disk confocal microscopy (SDCM). (Center) Representative images of ciliated cells from a single xy-plane of a z stack. (Right) Quantification of ciliary GFP-Rab11a showing mean ± SEM for ∼100 cells analyzed from n = 3 independent experiments. (C) Super-resolution imaging of Rab11 ciliary localization by Elyra 7 microscopy SIM2 in fixed RPE tRFP-Rab8a+GFP-Rab11a cells, treated with Dox for 24 h, serum starved the last 12 h, and stained with CEP164 antibody. Images shown are from a single xy-plane from a z stack. The lower image shows the fluorescence line profile plots of tRFP-Rab8a and GFP-Rab11a corresponding to the dotted line. (D) Super-resolution time-lapse imaging of Rab11 and Rab8 localization during ciliogenesis. Cells described in (B) were Dox treated for 24 h, serum starved for 3 h ,and then imaged live using the Elyra 7 microscope SIM2 every 10 min. Images shown are from a single xy-plane from a z stack. The lower image shows the fluorescence line profile plots as described in (C). Cilia are outlined in white. ∗p < 0.05; ∗∗p < 0.001. Scale bar: 1 μm. |
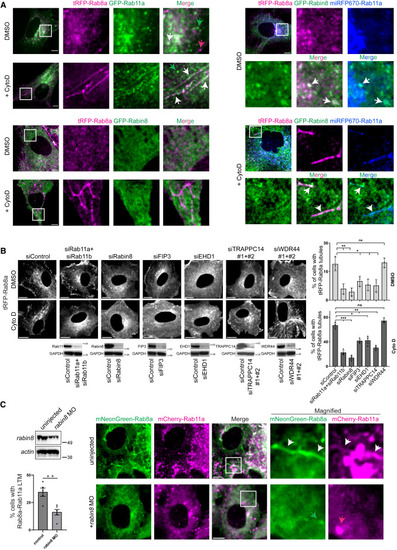
Rab11-Rab8 cascade association with Rab8 LTMs (A) Representative images of RPE tRFP-Rab8a+GFP-Rab11a, tRFP-Rab8a+GFP-Rabin8, and tRFP-Rab8a+GFP-Rabin8+miRFP670-Rab11a cells treated with Dox for 24 h and DMSO or CytoD for 30 min and imaged on an SDCM. Images shown are from a single xy-plane from a z stack. White arrows indicate colocalized vesicles or LTMs; green and magenta arrows indicate Rab11a and Rab8a vesicles that do not colocalize, respectively. (B) Quantification of tRFP-Rab8a LTMs in cells treated with siRNA for 72 h and Dox for the last 24 h, followed by DMSO or CytoD treatment for 30 min and imaged on SDCM. (Left) Representative single xy-plane image from a z stack of RPE tRFP-Rab8a treated with siRNA. (Right) Plot showing tRFP-Rab8a LTMs in cells treated with siRNA. Immunoblots (below immunofluorescence images) show protein expression from cell lysates stained with antibodies detecting actin and ablated proteins. Plot shows mean ± SEM for >100 cells from n = 3 independent experiments. (C) Characterization of Rabin8 dependence on Rab11-Rab8 colocalization on LTMs in zebrafish embryos. Immunoblot analysis (top left) of Rabin8 expression in 24 hpf MO-injected zebrafish embryos. Quantification of mNeonGreen-Rab8a+mCherry-Rab11a LTMs in embryos injected with mNeonGreen-Rab8a+mCherry-Rab11a with and without rabin8 MO (bottom left). Mean ± SEM for ∼100 cells analyzed per condition from n = 5 and 6 independent experiments for uninjected and rabin8 MO, respectively. (Right) Representative images captured on an SDCM is shown. White arrows indicate colocalized LTMs; green and magenta arrows indicate Rab8a and Rab11a vesicles that do not colocalize, respectively. ns, not significant; ∗p < 0.05; ∗∗p < 0.001; ∗∗∗p < 0.0001. Scale bar: 5 μm. |
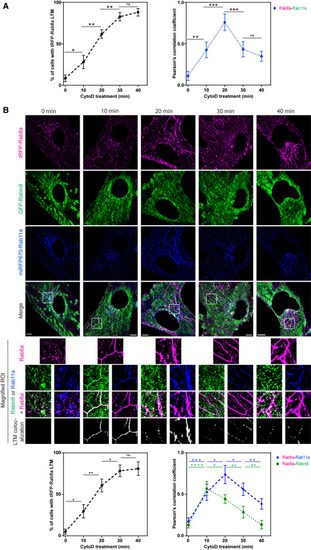
Membrane conversion protein dynamics of Rab11 and Rabin8 on Rab8 LTMs (A) (Left) Quantification of tRFP-Rab8a LTMs in RPE tRFP-Rab8a+GFP-Rab11a cells treated with Dox for 24 h (mean ± SEM for ∼100 cells from n = 3 experiments) imaged by Elyra 7 SIM2 (images in Figure S5). (Right) tRFP-Rab8a colocalization with GFP-Rab11a on LTMs (calculated from Pearson’s correlation coefficient). Mean ± SEM from n = 3 experiments where Pearson’s correlation coefficient was calculated from 3 areas of each cell with 5 cells analyzed per experiment. (B) Representative images of RPE tRFP-Rab8a+GFP-Rabin8+miRFP670-Rab11a treated with Dox for 24 h followed by CytoD and imaged on Elyra 7 SIM2. tRFP-Rab8a+GFP-Rabin8 and tRFP-Rab8a+miRFP670-Rab11a colocalization on LTMs from the magnified regions of interest are shown below. Bottom images: (left plot) quantification of tRFP-Rab8a LTMs, (right plot) Pearson’s correlation coefficient for tRFP-Rab8a colocalization with GFP-Rabin8 or miRFP670-Rab11a on LTMs as described in (A). ∗p < 0.05; ∗∗p < 0.001; ∗∗∗p < 0.0001; ∗∗∗∗p < 0.00001. Scale bar: 5 μm. |
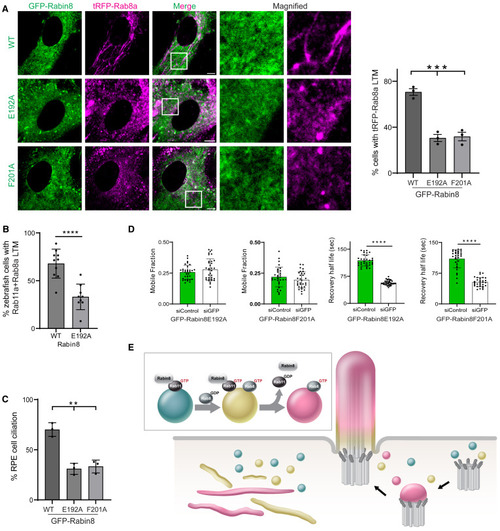
Rabin8 GEF activity is required for Rab8 LTM localization, ciliary trafficking, and ciliogenesis (A) (Right) Quantification of tRFP-positive LTMs in fixed RPE cells stably expressing tRFP-Rab8a and GFP-Rabin8 WT or GEF mutants (E192A and F201A) treated with Dox for 24 h, followed by CytoD for 30 min. (Left) Representative images from a single xy-plane of a z stack captured on an SDCM. Mean ± SEM for ∼100 cells from n = 3 experiments. (B) Quantification of mNeonGreen-Rab8a and mCherry-Rab11a colocalized on LTMs in yolk sac cells from 24 hfp zebrafish embryos co-injected with Rabin8 or Rabin8 E192A mRNA. Mean ± SEM for n = 10 (Rabin8) and n = 9 (Rabin8 E192A) independent experiments. (C) Quantification of ciliation in cells described in (A) following serum starvation for 24 h and stained with AcTub. Mean ± SEM for ∼100 cells from n = 3 experiments. (D) Quantification of FRAP recovery half-life and mobile fraction performed on cilia (∼5 μm) in RPE tRFP-Rab8a+GFP-Rabin8 E192A and RPE tRFP-Rab8a+GFP-Rabin8 F201A cells treated with siControl or siGFP for 72 h with Dox treatment and serum starvation for the last 24 h and 12 h, respectively. Mean ± SD from n = 3 independent experiments. (E) Model of Rab11-Rab8 cascade membrane conversion meditated by Rabin8. ∗p < 0.05; ∗∗p < 0.001; ∗∗∗p < 0.0001; ∗∗∗∗p < 0.00001. Scale bar: 5 μm. |
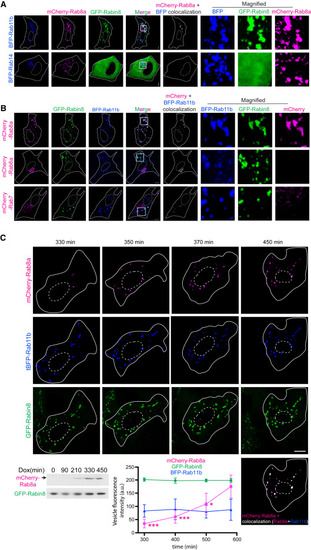
Rab8 is loaded onto enlarged Rabin8-Rab11 membranes (A) RPE cells transiently transfected with mCherry-Rab8a, GFP-Rabin8, and tBFP-Rab11b or BFP-Rab14 for 48 h. Representative images show a single xy-plane from a z stack captured on SDCM using a Hamamatsu Orca Flash4 camera. mCherry+tBFP colocalization is shown. (B) RPE GFP-Rabin8 cells transiently transfected with tBFP-Rab11b and mCherry-Rab8a, mCherry-Rab7 or mCherry-Rab6a for 48 h. Representative images show a single xy-plane from a z stack captured on SDCM with an EMCCD Evolve 512 camera. (C) RPE GFP-Rabin8+mCherry-Rab8a (Tet-inducible) cells transiently expressing tBFP-Rab11b and treated with Dox 24 h post-transfection imaged by time-lapse microscopy every 20 (representative images) or 25 min (plot). Representative images (top) show three-dimensional surface rendering of unfiltered z stack (step size, 1 μm) cell images for the time course. Image of BFP-Rab11b colocalization (white) with mCherry-Rab8a is shown at time point 450 min. Immunoblot shows expression of mCherry-Rab8a, detected with anti-Rab8 antibodies, and GFP-Rabin8, detected with GFP antibodies, following indicated Dox treatment times. Plot shows tBFP-Rab11b, mCherry-Rab8a, and GFP-Rabin8 fluorescence intensity in tBFP-positive vesicular structures (≥1 voxel) measured at the indicated times following Dox induction and plotted for five cells. Results shown as mean ± SD from two independent experiments. ∗p < 0.05; ∗∗∗p < 0.0001. Scale bar: 5 μm. |