
FIGURE
Fig. 5
Fig. 5
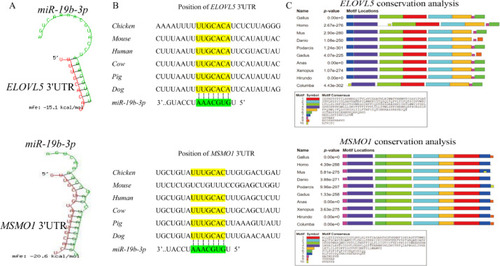
Conservative analysis of miR-19-3p binding sites and ELOVL5/MSMO1 motifs among species. (A) Prediction of minimum binding free energy between miR-19b-3p and potential target gene ELOVL5/MSMO1. (B) Conservative analysis of miR-19b-3p binding sites in MSMO1/ELOVL5 3′UTRs among different species. (C) Conservative motifs analysis of ELOVL5/MSMO1 among different species. Rectangles of different colors represent different motifs, and the length of the rectangle represents the number of amino acids. |
Expression Data
Expression Detail
Antibody Labeling
Phenotype Data
Phenotype Detail
Acknowledgments
This image is the copyrighted work of the attributed author or publisher, and
ZFIN has permission only to display this image to its users.
Additional permissions should be obtained from the applicable author or publisher of the image.
Full text @ Poult. Sci.