
FIGURE
Fig. 3
Fig. 3
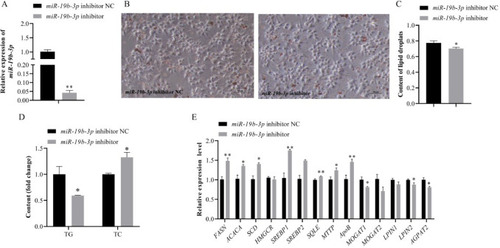
Effects of interference miR-19b-3p on lipid related indicators and genes in LMH. (A) The interference efficiency of miR-19b-3p inhibitor. (B) Oil Red O staining of LMH cells treated with miR-19b-3p inhibitor or inhibitor NC (C). Semiquantitative assessment of Oil Red O content absorbance detection at 510 nm. (D) Effects of interference miR-19b-3p on TG and TC contents in LMH cells. (E) Effects of interference miR-19b-3p on the expression of lipid metabolism-related genes. TG indicates triglycerides and TC indicates cholesterol |
Expression Data
Expression Detail
Antibody Labeling
Phenotype Data
Phenotype Detail
Acknowledgments
This image is the copyrighted work of the attributed author or publisher, and
ZFIN has permission only to display this image to its users.
Additional permissions should be obtained from the applicable author or publisher of the image.
Full text @ Poult. Sci.