
Fig. 3
- ID
- ZDB-FIG-240226-14
- Publication
- Baek et al., 2022 - Single-cell transcriptome analysis reveals three sequential phases of gene expression during zebrafish sensory hair cell regeneration
- Other Figures
- All Figure Page
- Back to All Figure Page
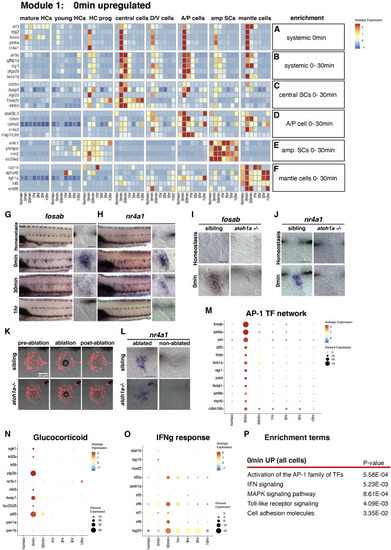
Injury/inflammatory response genes are rapidly upregulated 0 min after HC death (A and B) Heatmap of the expression of selected genes upregulated in all SCs at (A) 0 min and (B) 0–30 min. (C–F) Heatmaps of genes upregulated in different cell types at 0 min and 30 min after HC death. (G and H) ISH images of (G) fosab and (H) nr4a1 in neuromasts at homeostasis, 0 min, 30 min, and 1 h after HC death. Scale bar, 20 μm. (I and J) ISH images of (I) fosab and (J) nr4a1 expression in neuromasts of sibling and atoh1a CRISPR mutants at homeostasis and 0 min after HC death. Scale bar, 20 μm. (K) Confocal images of Tg(she:H2A-mCherry) neuromast cells and transmitted light during laser ablation in 5 dpf sibling and atoh1a CRISPR mutants. Scale bar, 20 μm. (L) ISH images of nr4a1 expression in laser-ablated and non-ablated neuromasts of sibling and atoh1a CRISPR mutants. Scale bar, 20 μm. (M–O) Dot plots of the relative expression of (M) AP-1 TF network members, (N) glucocorticoid receptor, and (O) IFN signaling in neuromasts during HC regeneration. (P) Gene enrichment term analysis for genes upregulated 0 min after HC death compared with all other time points. |
Reprinted from Developmental Cell, 57(6), Baek, S., Tran, N.T.T., Diaz, D.C., Tsai, Y.Y., Acedo, J.N., Lush, M.E., Piotrowski, T., Single-cell transcriptome analysis reveals three sequential phases of gene expression during zebrafish sensory hair cell regeneration, 799-819.e6, Copyright (2022) with permission from Elsevier. Full text @ Dev. Cell