
Fig. 1
- ID
- ZDB-FIG-240130-12
- Publication
- Yang et al., 2023 - Optimized protocol for live imaging of overnutrition-elicited interactions between immune cells and β cells in zebrafish
- Other Figures
- All Figure Page
- Back to All Figure Page
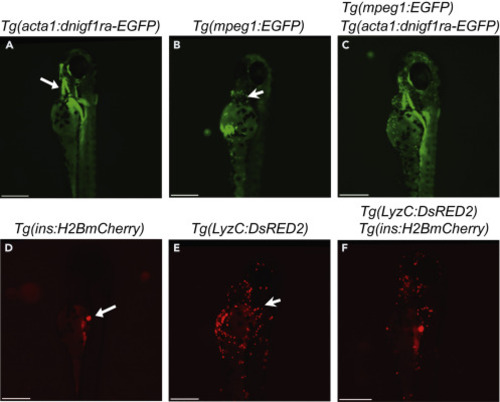
Identify fish with the desired genotypes (A) Image of Tg(acta1:dnigf1ra-EGFP)(zMIR ) fish at 4 dpf that expresses a dominant negative Igf1r-EGFP indicated by green immunofluorescence in skeletal muscle, particularly the jaw muscle (White arrow). (B) Image of Tg(mpeg1:EGFP) fish at 4 dpf with its macrophages labelled by EGFP (Green dots). The white arrow points to a macrophage. (C) Image of a zMIR larva that also has EGFP-labelled macrophages. (D) Image of a Tg(ins:H2B-mCherry) fish at 4 dpf showing red fluorescence in the β cells (White arrow). (E) Image of a Tg(lyzC:DsRed2) fish at 4 dpf showing red fluorescence in neutrophils (Red dot). The white arrow points to a neutrophil. (F) Image of a larva that has Tg(ins:H2B-mCherry) and Tg(lyzC:DsRed2). All scale bars represent 100 μm. |