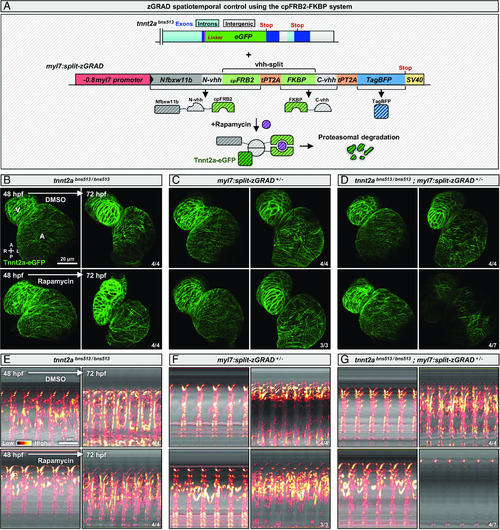
The cpFRB2-FKBP system enables fast temporal control of zGRAD activation. (A) Schematics of the tnnt2a locus showing the eGFP insertion at the C-terminus of the protein in the tnnt2abns513 allele and a tol2-generated allele containing the zGRAD elements split by the cpFRB2-FKBP system at the GFP nanobody region (split-zGRAD); upon rapamycin treatment, the cpFRB2 and FKBP proteins dimerize, reconstitute a functional GFP nanobody, and the zGRAD can target Tnnt2a-eGFP for proteasomal degradation. (B–D) Confocal images of hearts from 48 and 72 hpf tnnt2abns513/bns513 (B), myl7:split-zGRAD+/− (C); and tnnt2abns513/bns513; myl7:split-zGRAD+/− (D) animals treated with DMSO or rapamycin from 48 to 72 hpf; maximum z-projection; annotations correspond to the ventricle (V) and atrium (A); diagram indicates the anterior–posterior (A–P) and left–right (L–R) axes. (E–G) kymographs of hearts from 48 and 72 hpf tnnt2abns513/bns513 (E), myl7:split-zGRAD+/− (F), and tnnt2abns513/bns513; myl7:split-zGRAD+/− (G) animals treated with DMSO or rapamycin from 48 to 72 hpf; the reference axis of the kymograph is centered on the atrium; “Red hot” lookup table coloring (from Low to High) highlights the standard 3D variance. The same animals are used to image Tnnt2a-eGFP expression (B−D) and cardiac contractions (E−G).
|
