FIGURE SUMMARY
Title

Control of cardiac contractions using Cre-lox and degron strategies in zebrafish

Authors
Juan, T., Bellec, M., Cardoso, B., Athéa, H., Fukuda, N., Albu, M., Günther, S., Looso, M., Stainier, D.Y.R.
Source
Full text @ Proc. Natl. Acad. Sci. USA

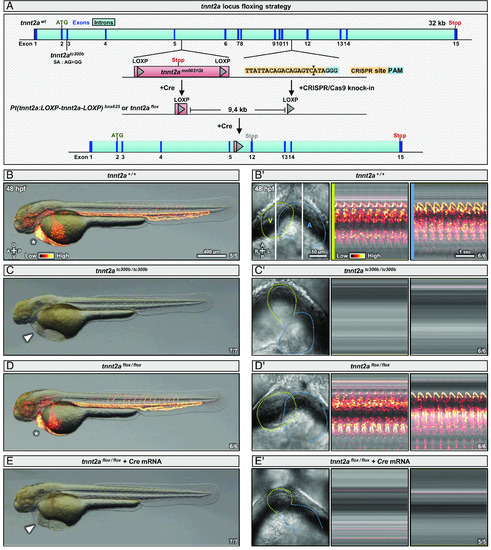
Global recombination of a floxed tnnt2a allele recapitulates the tnnt2a mutant phenotype. (A) Schematics of the tnnt2a locus showing the positions of the tc300b lesion and of the mn0031 gene-trap cassette; the first LOXP was obtained through Cre recombination of the gene-trap line, and the second LOXP was inserted via CRISPR/Cas9 knock-in using a ssODN donor in the recombined background; Cre-mediated recombination of the floxed allele leads to the removal of exons 6 to 11, and the formation of a PTC in exon 12; splice acceptor (SA); gray “Stop” is a PTC. (BE) Brightfield images of 48 hpf WT (B), tnnt2a mutant (C), and tnnt2aflox/flox embryos non-injected (D) or injected at the one-cell stage with Cre mRNA (E); arrowheads and asterisks indicate respectively the presence and absence of pericardial edema. (B'E’ ) Brightfield images and kymographs of hearts from 48 hpf WT (B’ ), tnnt2a mutant (C’ ), and tnnt2aflox/flox embryos non-injected (D’ ) or injected at the one-cell stage with Cre mRNA (E’ ); green lines outline the ventricle (V), blue lines outline the atrium (A), and vertical white lines indicate the reference axis of the kymographs. “Red hot” lookup table coloring (from Low to High) highlights the SD (BE) or 3D variance (B’E’ ). Diagrams indicate the anterior–posterior (A–P), dorsal–ventral (D–V), and left–right (L–R) axes.

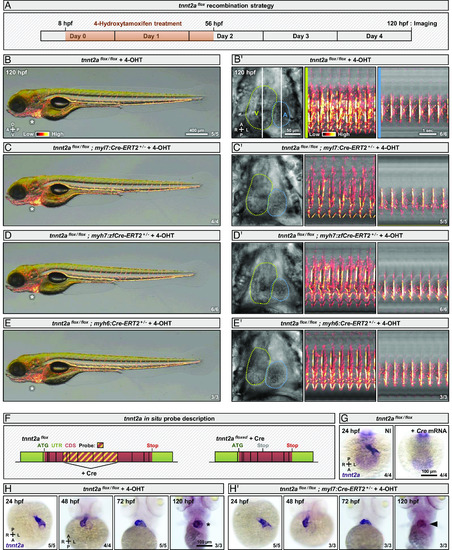
Myocardial Cre-lox-mediated tnnt2a deletion fails to induce early cardiac contraction defects. (A) Schematic of tnnt2a recombination strategy with 4-OHT treatment between 8 and 56 hpf to trigger early Cre-ERT2 activation, and imaging at 120 hpf. (BE) Brightfield images of 120 hpf tnnt2aflox/flox (B), tnnt2aflox/flox; myl7:Cre-ERT2+/− (C), tnnt2aflox/flox; myh7:zfCre-ERT2+/− (D), and tnnt2aflox/flox; myh6:Cre-ERT2+/− (E) larvae treated with 4-OHT; asterisks indicate the absence of pericardial edema. (B'E’ ) Brightfield images and kymographs of hearts from 120 hpf tnnt2aflox/flox (B’ ), tnnt2aflox/flox; myl7:Cre-ERT2+/− (C’ ), tnnt2aflox/flox; myh7:zfCre-ERT2+/− (D’ ), and tnnt2aflox/flox; myh6:Cre-ERT2+/− (E’ ) larvae treated with 4-OHT; green lines outline the ventricle (V), blue lines outline the atrium (A), and vertical white lines indicate the reference axis of the kymographs. (F) Schematics of WT and tnnt2aflox mRNA showing that the region bound by the in situ hybridization probe is removed by Cre recombination; gray “stop” is a PTC. (G) Brightfield images of 24 hpf tnnt2aflox/flox embryos, non-injected or injected at the one-cell stage with Cre mRNA, and stained for tnnt2a expression. (H and H’ ) Brightfield images of 24, 48, 72, and 120 hpf tnnt2aflox/flox (H), and tnnt2aflox/flox; myl7:Cre-ERT2+/− (H’ ) embryos and larvae treated with 4-OHT, and stained for tnnt2a expression; asterisk and arrowhead indicate respectively WT and decreased tnnt2a mRNA levels in the heart. “Red hot” lookup table coloring (from Low to High) highlights the SD (BE ) or 3D variance (B’E’). Diagrams indicate the anterior–posterior (A–P), dorsal–ventral (D–V), and left–right (L–R) axes.

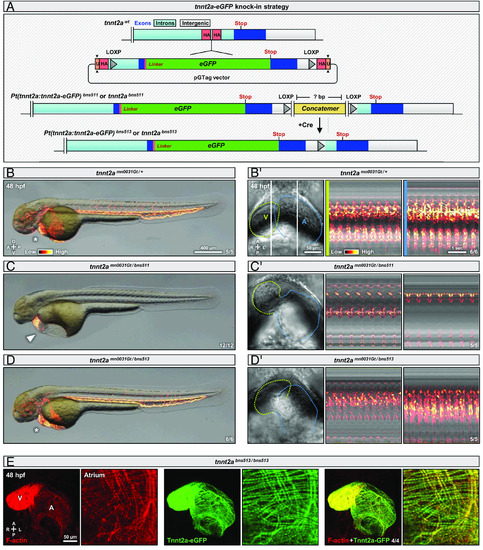
Viable endogenous eGFP-tagging recapitulates the Tnnt2a expression pattern. (A) Schematics of tnnt2a locus showing the insertion of an eGFP cassette at the C-terminus of the protein using the CRISPR/Cas9 knock-in vector pGTag; the knock-in cassette contains the last exon of tnnt2a and an eGFP before the stop codon, separated by a GSSS linker, and it is inserted in the last intron; 48 bp homology arms (HA) flanking the Cas9 cleavage site were used and the vector is cleaved at a universal (U) CRISPR site; the tnnt2abns511 allele contains a concatemer composed of multiple insert and vector backbone copies, which was removed by injecting Cre mRNA at the one-cell stage to create the tnnt2abns513 allele. (BD) Brightfield images of 48 hpf tnnt2amn0031Gt/+ (B), tnnt2amn0031Gt/bns511 (C), and tnnt2amn0031Gt/bns513 (D) embryos; arrowhead and asterisks indicate, respectively, the presence and absence of pericardial edema. (B'D') Brightfield images and kymographs of hearts from 48 hpf tnnt2amn0031Gt/+ (B’ ), tnnt2amn0031Gt/bns511 (C’ ), and tnnt2amn0031Gt/bns513 (D’ ) embryos; green lines outline the ventricle (V), blue lines outline the atrium (A), and vertical white lines indicate the reference axis of the kymographs. (E) Confocal image of a heart from a 48 hpf tnnt2abns513/bns513 embryo stained for F-actin with Phalloidin; maximum z-projection; annotations correspond to the ventricle (V) and atrium (A). “Red hot” lookup table coloring (from Low to High) highlights the SD (BD) or 3D variance (B’D’ ). Diagrams indicate the anterior–posterior (A–P), dorsal–ventral (D–V), and left–right (L–R) axes.

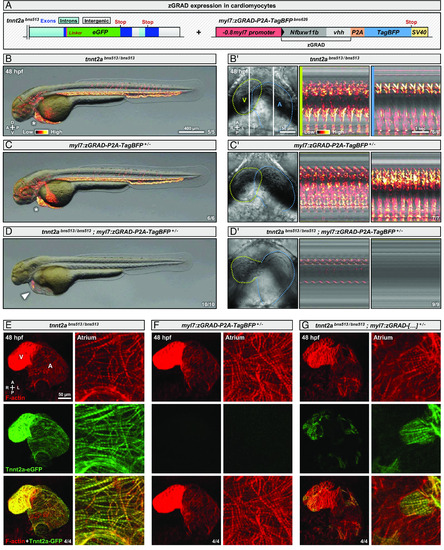
Myocardial Tnnt2a-eGFP degradation recapitulates the tnnt2a mutant phenotype. (A) Schematics of tnnt2a locus showing the eGFP insertion at the C-terminus of the protein in the tnnt2abns513 allele and a tol2-generated allele containing the zGRAD system with a TagBFP reporter separated by a P2A peptide under the control of the myocardial myl7 promoter; the zGRAD transgene is composed of the N-terminus of the F-box and WD repeat domain containing 11b (Nfbxw11b) protein and an anti-GFP nanobody (vhh). (BD) Brightfield images of 48 hpf tnnt2abns513/bns513 (B), myl7:zGRAD-P2A-TagBFP+/- (C), and tnnt2abns513/bns513; myl7:zGRAD-P2A-TagBFP+/− (D) embryos; arrowhead and asterisks indicate, respectively, the presence and absence of pericardial edema. (B'D’ ) Brightfield images and kymographs of hearts from 48 hpf tnnt2abns513/bns513 (B’ ), myl7:zGRAD-P2A-TagBFP+/− (C’ ), and tnnt2abns513/bns513; myl7:zGRAD-P2A-TagBFP+/− (D’ ) embryos; green lines outline the ventricle (V), blue lines outline the atrium (A), and vertical white lines indicate the reference axis of the kymographs. (EG) Confocal image of hearts from 48 hpf tnnt2abns513/bns513 (E), myl7:zGRAD-P2A-TagBFP+/− (F), and tnnt2abns513/bns513; myl7:zGRAD-P2A-TagBFP+/− (G) embryos stained for F-actin with Phalloidin; maximum z-projection; annotations correspond to the ventricle (V) and atrium (A). “Red hot” lookup table coloring (from Low to High) highlights the SD (BD) or 3D variance (B’D’). Diagrams indicate the anterior–posterior (A–P), dorsal–ventral (D–V), and left–right (L–R) axes.

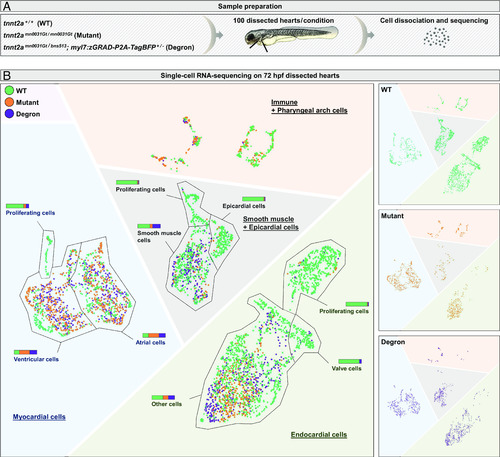
The cardiac transcriptomes of Tnnt2a degrons and tnnt2a mutants display high similarity at the single cell level. (A) Schematic and description of the sample preparation for single-cell RNA-sequencing; 100 hearts from 72 hpf WT, tnnt2amn0031Gt/mn0031Gt (Mutant), and tnnt2amn0031Gt/bns513; myl7:zGRAD-P2A-TagBFP+/− (Degron) larvae were dissected, dissociated and the single cell suspension sequenced. (B) Uniform manifold approximation and projection (UMAP) representation of the data; stacked columns represent the numbers of WT (green), mutant (orange), and degron (violet) cells for each annotated population; UMAP is displayed merged (Left) or split by genotype (Right).

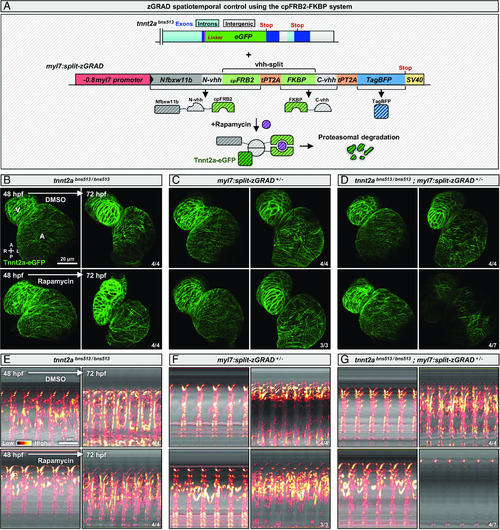
The cpFRB2-FKBP system enables fast temporal control of zGRAD activation. (A) Schematics of the tnnt2a locus showing the eGFP insertion at the C-terminus of the protein in the tnnt2abns513 allele and a tol2-generated allele containing the zGRAD elements split by the cpFRB2-FKBP system at the GFP nanobody region (split-zGRAD); upon rapamycin treatment, the cpFRB2 and FKBP proteins dimerize, reconstitute a functional GFP nanobody, and the zGRAD can target Tnnt2a-eGFP for proteasomal degradation. (BD) Confocal images of hearts from 48 and 72 hpf tnnt2abns513/bns513 (B), myl7:split-zGRAD+/− (C); and tnnt2abns513/bns513; myl7:split-zGRAD+/− (D) animals treated with DMSO or rapamycin from 48 to 72 hpf; maximum z-projection; annotations correspond to the ventricle (V) and atrium (A); diagram indicates the anterior–posterior (A–P) and left–right (L–R) axes. (EG) kymographs of hearts from 48 and 72 hpf tnnt2abns513/bns513 (E), myl7:split-zGRAD+/− (F), and tnnt2abns513/bns513; myl7:split-zGRAD+/− (G) animals treated with DMSO or rapamycin from 48 to 72 hpf; the reference axis of the kymograph is centered on the atrium; “Red hot” lookup table coloring (from Low to High) highlights the standard 3D variance. The same animals are used to image Tnnt2a-eGFP expression (BD) and cardiac contractions (EG).

Acknowledgments
This image is the copyrighted work of the attributed author or publisher, and ZFIN has permission only to display this image to its users. Additional permissions should be obtained from the applicable author or publisher of the image. Full text @ Proc. Natl. Acad. Sci. USA