
Fig. 5
- ID
- ZDB-FIG-240112-6
- Publication
- Bhat et al., 2023 - SLAMseq resolves the kinetics of maternal and zygotic gene expression during early zebrafish embryogenesis
- Other Figures
- All Figure Page
- Back to All Figure Page
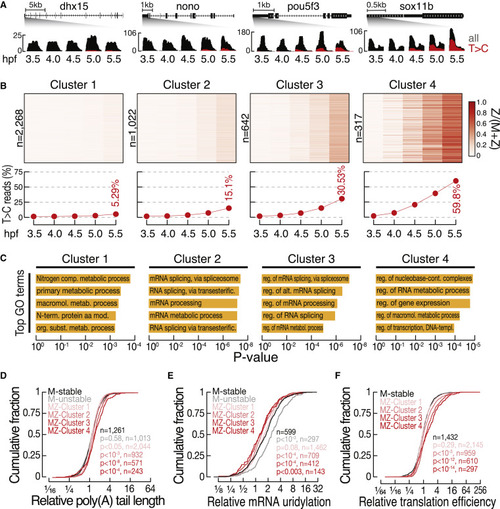
Replacement of MZ transcripts occurs at distinct rates that impinge on signatures of posttranscriptional control (A) Representative genome browser screenshots of MZ genes with constant abundance but distinct rates of zygotic replenishment. Zoom in to the 3′ end of genes shows total gene expression (all, gray) and zygotic expression (T>C, red) as determined at the indicated time points (in hpf). (B) Heatmap (top) shows the contribution of zygotic transcripts compared with total abundance (Z/[M + Z]) for the indicated number of genes (n) classified into four groups (clusters 1–4) by k-medoids clustering. The average contribution of zygotic expression to transcript abundances (bottom) and the maximum replacement at 5.5 hpf are indicated. See also Table S4. (C) Top five GO terms significantly enriched in each of the gene clusters described in (B). (D and E) Cumulative distribution of the change in poly(A)-tail length (D) and mRNA 3′ end uridylation (E) after vs. before ZGA (6 vs. 2 hpf), as measured by Chang et al.26 The indicated number of genes (n) classified into maternal-stable (black), maternal-unstable (gray), and MZ clusters (1–4, shades of red; see Figure 4) are shown. p values (Komogorov-Smirnov test) are indicated for comparisons of maternal-unstable with all other transcript categories. (F) Cumulative distribution of the change in translation efficiency post- (shield stage, ∼6 hpf) vs. pre-MZT (256 cell stage, ∼2.5 hpf). Translation efficiency was determined by Chew et al.27 The indicated number of genes (n) classified into maternal-stable (black), maternal-unstable (gray), and MZ clusters (1–4, shades of red; see Figure 4) are shown. p values (Komogorov-Smirnov test) are indicated for comparisons of maternal unstable with all other transcript categories. |