
Fig. 6
- ID
- ZDB-FIG-240112-27
- Publication
- Wang et al., 2023 - Amacrine cells differentially balance zebrafish color circuits in the central and peripheral retina
- Other Figures
- All Figure Page
- Back to All Figure Page
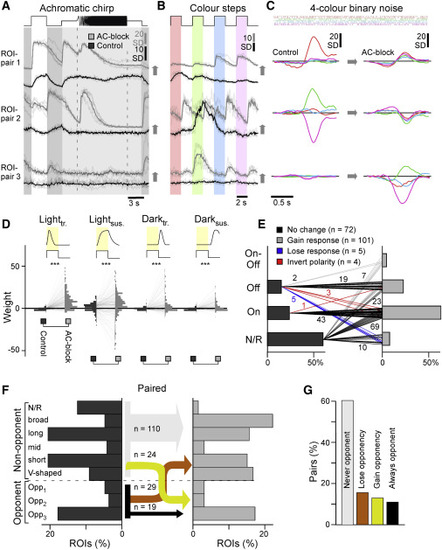
Paired recordings (A–C) Example ROI pairs as indicated in Figures S8A–S8D, illustrating frequently observed effects of AC block on single terminals when probed with the same set of stimuli used to classify all ACs (Figure 1) and BCs (Figure 4). Chirp and color-step traces (E and F) are vertically offset between the two conditions for clarity. (D) As Figures 5E and 5F but here for paired data (n = 182 pairs, from 13 scans, 13 fishes); pairwise weight distributions for the four kinetic components under the control (left) and AC block condition (right), as indicated. (E) Paired BCs automatically sorted by polarity under control (left) and AC block conditions (right). Lines represent the pairs, with numbers of BCs indicated. Chi-square test, p < 0.001. (F) As Figure 5H, allocation of BCs into spectral groups, here shown for a paired dataset, which allowed connecting spectral groups under the control condition (left) and following AC block (right). For simplicity, connections are collapsed into those where there is no change in color opponency (gray, black), where color opponency is lost upon AC block (orange), and where opponency is gained (yellow), with numbers of BC pairs corresponding to each connection indicated. Note that non-responsive terminals are added as one extra non-opponent category, which resulted from the generally lower signal-to-noise ratio in SyGCaMP3.5 recordings compared with the previously used SyjGCaMP8m. (G) Summary of changes to color opponency as shown in (F). |