
FIGURE
Fig. 3
- ID
- ZDB-FIG-240112-24
- Publication
- Wang et al., 2023 - Amacrine cells differentially balance zebrafish color circuits in the central and peripheral retina
- Other Figures
- All Figure Page
- Back to All Figure Page
Fig. 3
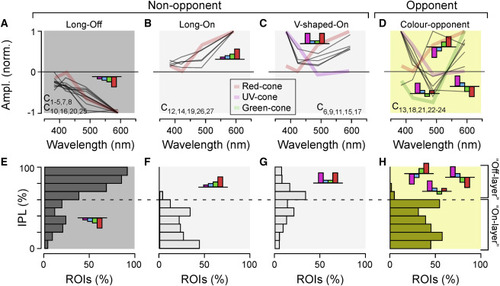
ACs are kinetically diverse but spectrally simple (A–D) Spectral tuning functions of all AC clusters (gray lines), allocated to one of four groups as shown: long-wavelength-biased Off (A) and On (B), V-shaped On (C), and color opponent (D). Plotted behind the AC spectral tunings are reduced tuning functions of selected cones (cf. Figures S5B and S5C) to illustrate qualitative spectral matches between cones and AC clusters. Clusters contributing to each group are listed in each panel. (E–H) Corresponding IPL distribution of AC ROIs allocated to each of the four spectral groups, as indicated. |
Expression Data
Expression Detail
Antibody Labeling
Phenotype Data
Phenotype Detail
Acknowledgments
This image is the copyrighted work of the attributed author or publisher, and
ZFIN has permission only to display this image to its users.
Additional permissions should be obtained from the applicable author or publisher of the image.
Full text @ Cell Rep.