
FIGURE
Fig. 1
- ID
- ZDB-FIG-240104-20
- Publication
- Alnassar et al., 2023 - angptl4 gene expression as a marker of adaptive homeostatic response to social isolation across the lifespan in zebrafish
- Other Figures
- All Figure Page
- Back to All Figure Page
Fig. 1
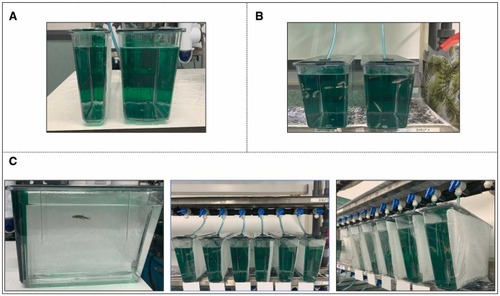
Photographs of the experimental setup. (A) The 1.4 L (left) and 2.8 L (right) tanks used for housing the socially isolated fish and the social controls, respectively. (B) The social control fish were kept in groups of n = 10 (5 males, 5 females) per 2.8 L tank. (C) The isolated fish were housed individually in 1.4 L tanks with opaque white cards placed between them. |
Expression Data
Expression Detail
Antibody Labeling
Phenotype Data
Phenotype Detail
Acknowledgments
This image is the copyrighted work of the attributed author or publisher, and
ZFIN has permission only to display this image to its users.
Additional permissions should be obtained from the applicable author or publisher of the image.
Reprinted from Neurobiology of aging, 131, Alnassar, N., Hillman, C., Fontana, B.D., Robson, S.C., Norton, W.H.J., Parker, M.O., angptl4 gene expression as a marker of adaptive homeostatic response to social isolation across the lifespan in zebrafish, 209221209-221, Copyright (2023) with permission from Elsevier. Full text @ Neurobiol. Aging