
- Title
-
angptl4 gene expression as a marker of adaptive homeostatic response to social isolation across the lifespan in zebrafish
- Authors
- Alnassar, N., Hillman, C., Fontana, B.D., Robson, S.C., Norton, W.H.J., Parker, M.O.
- Source
- Full text @ Neurobiol. Aging
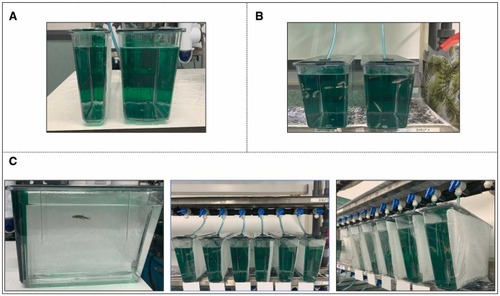
Photographs of the experimental setup. (A) The 1.4 L (left) and 2.8 L (right) tanks used for housing the socially isolated fish and the social controls, respectively. (B) The social control fish were kept in groups of n = 10 (5 males, 5 females) per 2.8 L tank. (C) The isolated fish were housed individually in 1.4 L tanks with opaque white cards placed between them. |

Volcano plots showing the differential gene expression in log2 (fold change) on the x-axis and significance level (−log10 [p-value]) on the y-axis in the comparison between (A) socially isolated fish and social controls and (B) reintroduced fish after social isolation and social controls. The horizontal lines indicate the significance level, whereas the vertical lines indicate the |logFC)| ≥ 1 cutoff. The red and blue dots represent the significantly upregulated and downregulated differentially expressed genes, respectively (|logFC| ≥ 1 and false discovery rate-adjusted p-value < 0.05). |

Biological process and cellular component GO terms that were enriched in the upregulated genes in the isolated 6-month-old fish compared to their age-matched social controls. Abbreviation: GO, gene ontology. |

Young adult fish (A) 6-month-old social, 48-hour isolated and 6-day isolated fish and (B) 6-month-old social, 2-week isolated fish with and without reintroduction. Data are represented as mean ± SD; ∗p < 0.05, ∗∗p < 0.01. Novel tank test time in the top zone responses for (C) 6-month-old social and 48-hour isolated fish, (D) 6-month-old social and 6-day isolated fish, and (E) 6-month-old social and 2-week isolated fish. Data are represented as estimated marginal means ± SEM. |
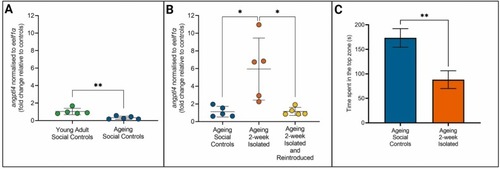
Aging fish (A) 24-month-old social and 6-month-old social fish, (B) 24-month-old social and 2-week isolated fish with and without reintroduction. Data are represented as mean ± SD; *p < 0.05, **p < 0.01. Novel tank test time in the top zone responses for (C) 24-month-old social and 2-week isolated fish. Data are represented as estimated marginal means ± SEM. |
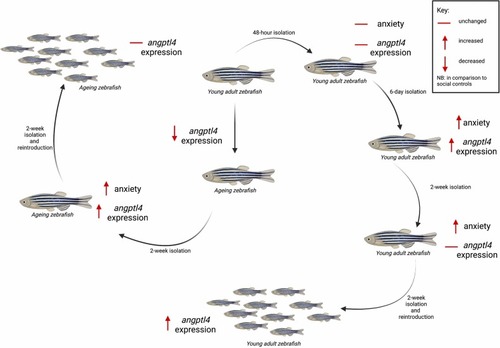
Schematic summarizing the timeline of anxiety and angptl4 expression effects following social isolation of young adult fish and aging zebrafish. |

|
Reprinted from Neurobiology of aging, 131, Alnassar, N., Hillman, C., Fontana, B.D., Robson, S.C., Norton, W.H.J., Parker, M.O., angptl4 gene expression as a marker of adaptive homeostatic response to social isolation across the lifespan in zebrafish, 209221209-221, Copyright (2023) with permission from Elsevier. Full text @ Neurobiol. Aging