FIGURE

Figure 3

ID
ZDB-FIG-231212-30
Publication
Bernal-Bermúdez et al., 2023 - A zebrafish model of Ifih1-driven Aicardi-Goutières syndrome reproduces the interferon signature and the exacerbated inflammation of patients
Other Figures
All Figure Page
Back to All Figure Page
Figure 3

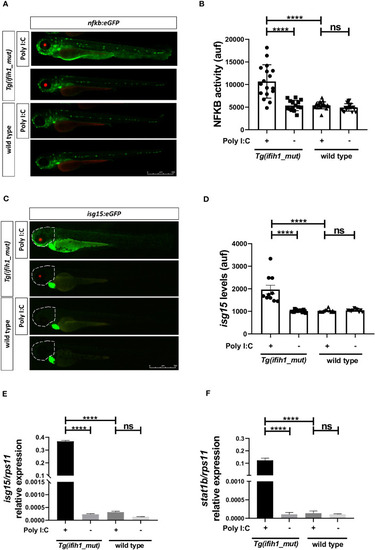
Real-time visualization of inflammation and type I IFN induction in Tg(ifih1_mut) upon poly I:C induction. nfkb:eGFP and isg15:eGFP (green heart marker) reporter zebrafish lines were crossed with Tg(ifih1_mut) (red eye marker) and injected or not with poly I:C. Nfkb activity (A, B) and isg15 levels (C, D) were analyzed by fluorescence microscopy and quantified. Each dot represents a larva and the mean ± SEM for each experimental group is also shown. Representative merge images of whole larvae were also shown (A, C). (E, F) Transcript levels of isg15 and stat1b in larvae from the cross of nfkb:eGFP and Tg(ifih1_mut) were analyzed by RT-qPCR and the results are shown as the mean ± SEM of pooled larvae. The region of interest (ROI) used to quantify the fluorescence in isg15:eGFP reporter line is indicated as a dot line in the images (C). p-values were calculated using one-way ANOVA and Tukey multiple range test. ns, not significant; ****p ≤ 0.0001.

Expression Data

Expression Detail
Antibody Labeling
Phenotype Data

Phenotype Detail
Acknowledgments
This image is the copyrighted work of the attributed author or publisher, and ZFIN has permission only to display this image to its users. Additional permissions should be obtained from the applicable author or publisher of the image. Full text @ Front Immunol