
FIGURE
Figure 5—figure supplement 1.
- ID
- ZDB-FIG-231122-8
- Publication
- Kim et al., 2023 - scMultiome analysis identifies embryonic hindbrain progenitors with mixed rhombomere identities
- Other Figures
-
- Figure 1—figure supplement 1.
- Figure 1—figure supplement 1.
- Figure 2—figure supplement 1.
- Figure 2—figure supplement 1.
- Figure 3—figure supplement 1.
- Figure 3—figure supplement 1.
- Figure 4—source data 1.
- Figure 5—figure supplement 1.
- Figure 5—figure supplement 1.
- Figure 5—figure supplement 2.
- Figure 5—figure supplement 3.
- Figure 5—figure supplement 4.
- Figure 5—figure supplement 5.
- Figure 5—figure supplement 6.
- Figure 5—figure supplement 7.
- Figure 6—figure supplement 1.
- Figure 6—figure supplement 1.
- Figure 7—figure supplement 1.
- Figure 7—figure supplement 1.
- Figure 7—figure supplement 2.
- Figure 8.
- All Figure Page
- Back to All Figure Page
Figure 5—figure supplement 1.
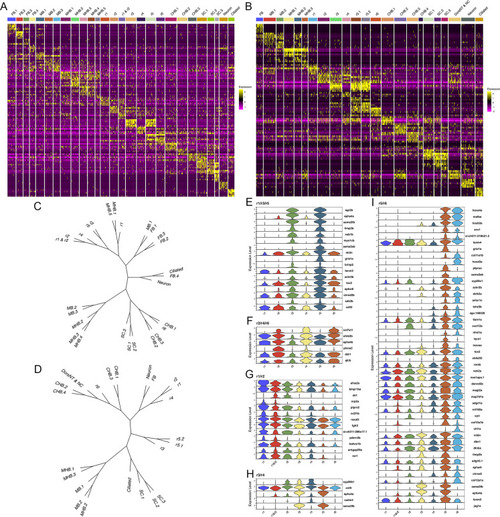
Each rhombomere displays a unique molecular profile. See also Figure 5—figure supplements 1–7. (A, B) Heat maps showing the expression of the top five enriched genes in each cluster at 13hpf (A) and 16hpf (B). Gene order in A and B is the same as in Figures 1B and 2B, respectively. (C, D). Dendrograms showing the relationship between each neural cluster at 13hpf (C) and 16hpf (D). ( E-I). Violin plots showing expression levels of genes enriched in odd (E) or even (F) rhombomeres, as well as genes enriched in adjacent pairs of rhombomeres (G–I), at 13hpf. |
Expression Data
Expression Detail
Antibody Labeling
Phenotype Data
Phenotype Detail
Acknowledgments
This image is the copyrighted work of the attributed author or publisher, and
ZFIN has permission only to display this image to its users.
Additional permissions should be obtained from the applicable author or publisher of the image.
Full text @ Elife