
FIGURE
Figure 2—figure supplement 1.
- ID
- ZDB-FIG-231122-3
- Publication
- Kim et al., 2023 - scMultiome analysis identifies embryonic hindbrain progenitors with mixed rhombomere identities
- Other Figures
-
- Figure 1—figure supplement 1.
- Figure 1—figure supplement 1.
- Figure 2—figure supplement 1.
- Figure 2—figure supplement 1.
- Figure 3—figure supplement 1.
- Figure 3—figure supplement 1.
- Figure 4—source data 1.
- Figure 5—figure supplement 1.
- Figure 5—figure supplement 1.
- Figure 5—figure supplement 2.
- Figure 5—figure supplement 3.
- Figure 5—figure supplement 4.
- Figure 5—figure supplement 5.
- Figure 5—figure supplement 6.
- Figure 5—figure supplement 7.
- Figure 6—figure supplement 1.
- Figure 6—figure supplement 1.
- Figure 7—figure supplement 1.
- Figure 7—figure supplement 1.
- Figure 7—figure supplement 2.
- Figure 8.
- All Figure Page
- Back to All Figure Page
Figure 2—figure supplement 1.
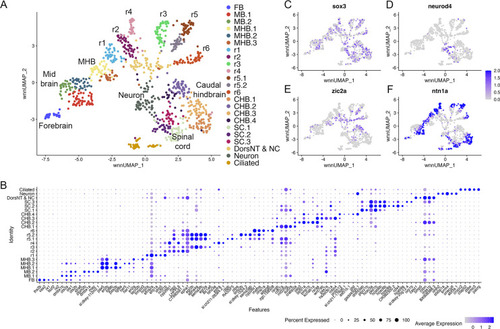
(A) UMAP of 16hpf neural clusters. (B) Dot plot showing the expression of the top five enriched genes in each cluster. (C, D) Feature plots showing the expressing of sox3 (C) and neurod4 (D). (E, F) Feature plots showing the expression of dorsoventral marker genes. dorsNT = dorsal neural tube, NC = neural crest. See legend to Figure 1 for additional abbreviations. |
Expression Data
Expression Detail
Antibody Labeling
Phenotype Data
Phenotype Detail
Acknowledgments
This image is the copyrighted work of the attributed author or publisher, and
ZFIN has permission only to display this image to its users.
Additional permissions should be obtained from the applicable author or publisher of the image.
Full text @ Elife