
FIGURE
Fig. 5
- ID
- ZDB-FIG-231121-29
- Publication
- Li et al., 2023 - Tissue-specific temperature dependence of RNA editing levels in zebrafish
- Other Figures
- All Figure Page
- Back to All Figure Page
Fig. 5
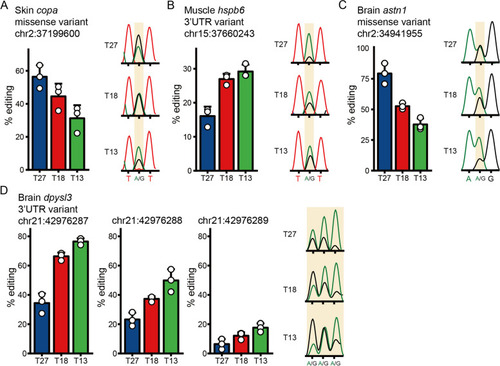
Validation of the dynamic change of RNA editing sites by Sanger sequencing. For each panel, the left bar graph indicates the editing level detected by the in silico method for the three temperatures (Data are shown as the mean ± SD, |
Expression Data
Expression Detail
Antibody Labeling
Phenotype Data
Phenotype Detail
Acknowledgments
This image is the copyrighted work of the attributed author or publisher, and
ZFIN has permission only to display this image to its users.
Additional permissions should be obtained from the applicable author or publisher of the image.
Full text @ BMC Biol.