FIGURE SUMMARY
Title

Tissue-specific temperature dependence of RNA editing levels in zebrafish

Authors
Li, W., Bu, M., Hu, R., Jiang, S., Chen, L., Somero, G.N.
Source
Full text @ BMC Biol.

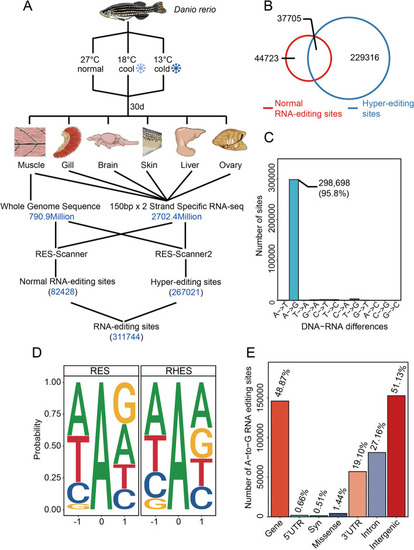
Experimental strategies and the RNA editome in zebrafish. A Experimental design for RNA editing study in cold-acclimated zebrafish. B Venn diagram showing the distribution of candidate normal and hyper-edited sites. C Relative abundance of each editing type. A-to-G refers to A-to-I editing because I is read as a G during translation. D The preferred editing site deduced from the zebrafish editome. “RES” indicates normal RNA edit sites; “RHES” indicates RNA hyper-edited sites. E The relative abundance of editing in various genomic regions. Syn indicates synonymous CDS sites. Only females were used in analysis. Data from all acclimation groups were pooled to assess the relative prevalence of editing types

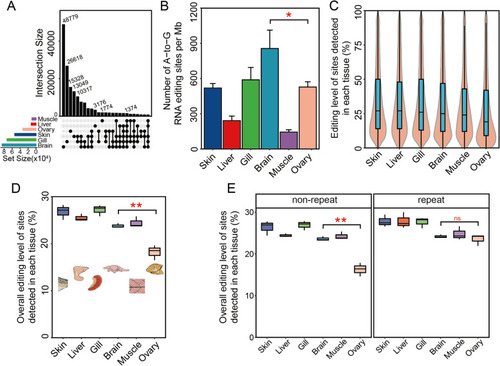
Characteristics of tissue-specific editomes in zebrafish. A Number of (commonly) edited sites of a single tissue or sites common to two or more tissues. This graphical UpSetR plot visualizes intersections of RNA editing sets in which the rows of the matrix represent the sets of tissues and columns represent their intersections (shared RNA editing behavior). Black filled circles indicate intersections; light gray circles indicate no intersection. The sizes of the intersections are shown by the bar graph above the matrix. B The per Mb density of edited sites for each tissue. Data are shown as the mean ± SD, n = 3. C Editing level at the detected edited sites in each tissue. Editing level was estimated as the number of G/the number of (G + A) in each editing site, in which G is the edited base count and A is the reference allele count. The shaded areas represent the distribution of editing levels. The horizonal lines in the boxes represent the median value of editing levels. D, E Overall editing levels of sites detected in each tissue of whole genome (D), and non-repeat DNA regions or repeat DNA regions (E) sites in various zebrafish tissues. Overall editing level is defined as the percentage of edited nucleotides at all known editing sites and was estimated as the total number of G in all editing sites/the total number of (A + G) in all editing sites. Statistical significance between brain and ovary for “Number of A-to-G RNA editing sites per Mb” and “Overall editing level of sites detected in each tissue (%)” were calculated using an unpaired t-test. n = 3, ns, not significant, *P < 0.05, **P < 0.01

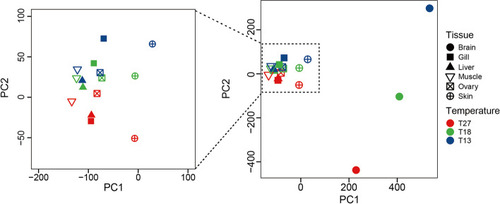
Principal component analysis of RNA editing across tissues from zebrafish acclimated to different temperatures

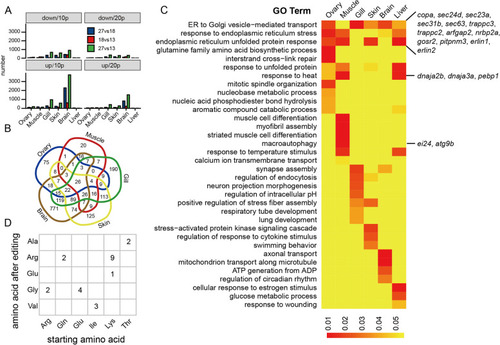
Differential A-to-I RNA editing sites and their related function. A Variation in the number of differential RNA editing sites across tissues and temperatures with reduced (down) and increased (up) sites shown separately. 10p and 20p indicate 10 or 20% difference, respectively (T27 compared with T18, T27 compared with T13 and T18 compared with T13). B A Venn diagram of differential RNA editing sites involving genes that have 10% differences (10p) in editing. C Gene Ontology analysis of differential RNA editing-related genes. D An amino acid substitution matrix showing the detected amino acid changes after RNA editing, with the number of each type of substitution shown

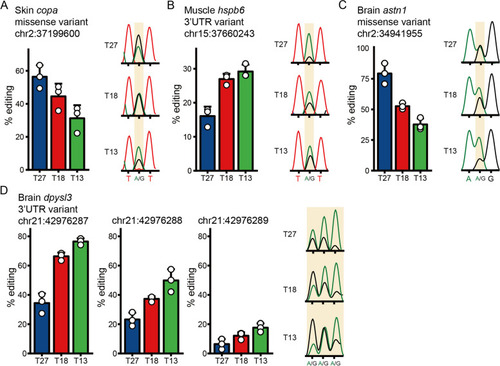
Validation of the dynamic change of RNA editing sites by Sanger sequencing. For each panel, the left bar graph indicates the editing level detected by the in silico method for the three temperatures (Data are shown as the mean ± SD, n = 3), while the right graphs indicate the editing levels inferred from Sanger sequencing for each temperature. In the right graphs, the blue line represents guanosine (G) and the black line represents adenosine (A)

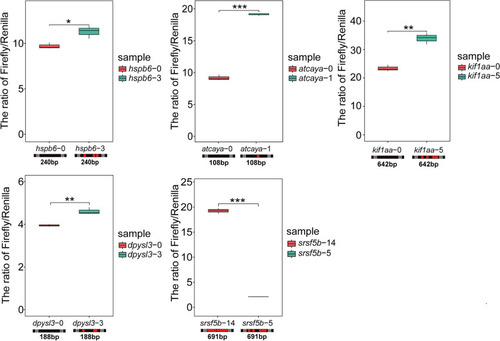
The relationship between the number of edited sites and efficiency of protein synthesis. The ratio of firefly (test) to Renilla (background) synthesis (measured as luminescence) detected in the 5 mRNA species indicates efficiency of protein synthesis. Data for warm-preference editing pattern are shown by the left-side bars in each frame; data for cold-preference editing pattern are in the right side of each frame. The number of edited sites in the fragment of the 3′UTR linked to the firefly luciferase reporter gene is shown in the name of the gene after the dash symbol. The bar under each mRNA indicates the length and the locations of edited sites (in red). Significance testing was performed by Student’s t-test. n = 3, *P < 0.05, **P < 0.01, ***P < 0.001

Acknowledgments
This image is the copyrighted work of the attributed author or publisher, and ZFIN has permission only to display this image to its users. Additional permissions should be obtained from the applicable author or publisher of the image. Full text @ BMC Biol.