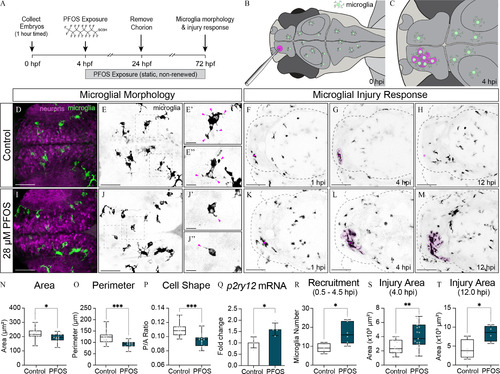
Microglia morphology and response to minor brain injury in 3-dpf larvae exposed to 28μM PFOS. (A) Exposure paradigm: zebrafish embryos from Tg(mpeg1:EGFP) adults were collected after a 1-h timed spawn. At 4 hpf, embryos were dosed with 0.1% DMSO (Control) or 28μM PFOS. Treatment solutions were static and not renewed. Embryos were dechorionated at 24 hpf, and imaging and injury experiments were conducted at 3 dpf. (B) Schematic of larval brain injury: a pulled-glass needle (OD 9μm) was used to puncture the right telencephalon of larval zebrafish. (C) Hypothetical schematic of microglia response 4 h post-injury (hpi). (D) Confocal micrographs of 3-dpf control-treated larvae with fluorescently labeled neurons and microglia. (E) Isolated fluorescently labeled microglia from (D). (E′–E″) 3× magnified microglia from boxes in (E). Magenta arrows point to projections emanating from the microglia cell bodies. (F) Dorsal view of a representative 3-dpf control-treated larval brain at 1 hpi. Injury site marked with magenta dot. (G) Dorsal view of a representative 3-dpf control-treated larval brain at 4 hpi. (H) Dorsal view of a representative 3-dpf control-treated larval brain at 12 hpi. (I) Confocal micrographs of 3-dpf 28μM PFOS-treated larvae with fluorescently labeled neurons and microglia. (J) Micrographs from (I) isolating just the fluorescently labeled microglia. (J′–J″) 3× magnified microglia from boxes in (J). Magenta arrows point to projections emanating from the microglia cell bodies. (K) Dorsal view of a representative 3-dpf 28μM PFOS-treated larval brain at 1 hpi. Injury site marked with magenta dot. (L) Dorsal view of a representative 3-dpf 28μM PFOS-treated larval brain at 4 hpi. (M) Dorsal view of a representative 3-dpf 28μM PFOS-treated larval brain at 12 hpi. (N) Quantification of microglia cell area. (O) Quantification of microglia cell perimeter. (P) Perimeter-to-area ratio of control-treated and PFOS-treated microglia. n=15 fish per group; 3–18 cells counted per fish. (Q) qRT-PCR results assessing the relative expression of the microglia activation gene, p2ry12, in isolated heads of control- and PFOS-treated 3-dpf larvae. n=4 samples of 10 pooled heads. (R) Number of microglia recruited to the injury site between 0.5 and 4.5 hpi. n=5–6 per group. (S) Quantification of the area of microglia response around the injury site at 4 hpi, as shown as the magenta overlays in (G) and (I). n=19–20 fish per group. (T) Quantification of the area of microglia response around the injury site at 12 hpi. n=4 fish per group. Confocal micrographs at 40× magnification (D–E″ and I–J″) or 20× magnification (F–H; K–M). Error bars represent standard deviation. Box plot limits represent 25th to 75th percentile, with the midline representing the median. *p<0.05; **p<0.01; ***p<0.001. See Excel Table S1 for additional statistical details. Note: DMSO, dimethyl sulfoxide; dpf, days post fertilization; hpf, hours postfertilization; PFOS, perfluorooctane sulfonate.
|
