
Fig. 1
- ID
- ZDB-FIG-231109-9
- Publication
- Yu et al., 2023 - Cell competition for neuron-derived trophic factor controls the turnover and lifespan of microglia
- Other Figures
- All Figure Page
- Back to All Figure Page
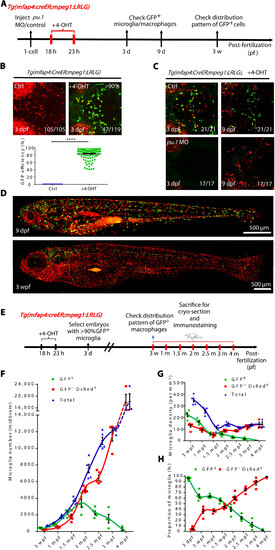
The developmental dynamics of RBI and AGM microglia. (A) A timeline indicates 4-OHT treatment and fluorescent imaging of Tg(mfap4:CreER;mpeg1:LRLG) embryos. (B) Fluorescence imaging of microglia in the brain of 3 dpf Tg(mfap4:CreER;mpeg1:LRLG) embryos treated with 4-OHT from 18 to 23 hpf (top) and quantification of the label efficiency by percentage (GFP+ cells in total microglia in 3-dpf brain) (bottom) (Ctrl n = 105, +4-OHT n = 119). (C) Fluorescence imaging of microglia in the brain of 3 and 9 dpf control or pu.1 MO injected Tg(mfap4:CreER;mpeg1:LRLG) embryos treated with 4-OHT from 18 to 23 hpf. (D) Fluorescence imaging of 4-OHT–treated Tg(mfap4:CreER;mpeg1:LRLG) larva at 9 dpf and 3 wpf. Zebrafish larvae were in lateral view with anterior to the left to visualize the distribution of GFP+ cells throughout the body. (E) Schematic diagram shows the experimental setup for the treatment of embryos with 4-OHT and collection of samples for cryo-section. (F) Quantification of the absolute number of RBI and AGM microglia in the developing and adult midbrain. (G) Quantification of the density of RBI and AGM microglia in the developing and adult midbrain. (H) Quantification of the proportion of RBI and AGM microglia in the developing and adult midbrain. (F) to (H) Data were presented as mean ± SEM (3 dpf n = 12, 3 wpf n = 5, 1 mpf n = 5, 1.5 mpf n = 5, 2 mpf n = 5, 2.5 mpf n = 5, 3 mpf n = 4, and 4 mpf n = 3). |