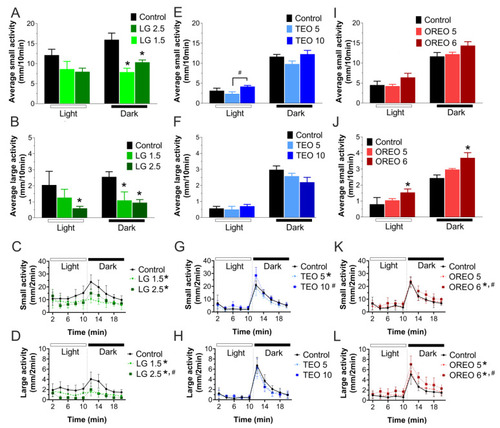
Zebrafish larvae behavior in excitatory dark–light locomotor test. (A–F) Bars show the average of small (between 4 and 8 mm/s) or large (>8 mm/s) activity movement for each dark or light period (10 min). (G–L) Average swimming behavior (2 min) in each complete dark–light cycle (20 min). Behavior test was analyzed by one-way ANOVA in light period (lemongrass EO small activity (F(2, 15) = 2.273, p = 0.14), large activity (F(2, 15) = 3.943, p < 0.05); thyme EO small activity (F(2, 15) = 3.463, p = 0.06), large activity (F(2, 15) = 0.5043, p = 0.61); oregano EO small activity (F(2, 15) = 1.984, p = 0.17), large activity (F(2, 15) = 4.964, p < 0.05)) and dark period (lemongrass EO small activity (F(2, 15) = 13.10, p < 0.05), large activity (F(2, 15) = 12.77, p < 0.05); thyme EO small activity (F(2, 15) = 2.829, p = 0.09), large activity (F(2, 15) = 2.547, p = 0.11); oregano EO small activity (F(2, 15) = 2.925, p = 0.08), large activity (F(2, 15) = 8.370, p < 0.05)). When the time variable was considered, two-way ANOVA test was realized in small activity: lemongrass EO small activity (F(2, 69) = 9.015, p < 0.05) and large activity (F(2, 69) = 9.924, p < 0.05); thyme EO small activity (F(2, 69) = 1.436, p = 0.24) and large activity (F(2, 69) = 0.456, p = 0.64); oregano EO small activity (F(2, 69) = 1.951, p = 0.15) and large activity (F(2, 69) = 2.746, p = 0.07). * Represents statistically significant (p < 0.05) difference by control group. # Represents statistically significant (p < 0.05) difference by another essential-oil group.
|
