FIGURE SUMMARY
Title

Essential Oils Produce Developmental Toxicity in Zebrafish Embryos and Cause Behavior Changes in Zebrafish Larvae

Authors
da Silva, I.I., da Silva, N.P.C., Marrs, J.A., Cadena, P.G.
Source
Full text @ Biomedicines

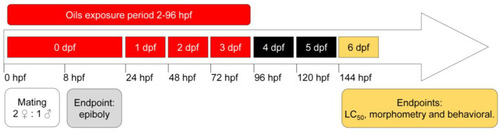
Schematic representation of tests performed for toxicity evaluation of plant essential oils in embryo and larvae zebrafish.

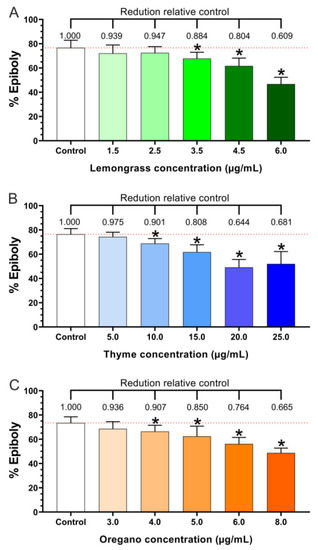
Epiboly percentages at 8 hpf in zebrafish embryos exposed to (A) lemongrass, (B) thyme, and (C) oregano essential oils. Test F by one-way ANOVA: lemongrass EO (F(5, 77) = 48.83, p < 0.05); thyme EO (F(5, 76) = 48.97, p < 0.05); and oregano EO (F(5, 72) = 29.95, p < 0.05). * Statistically different from the control group (one-way ANOVA test, p < 0.05).

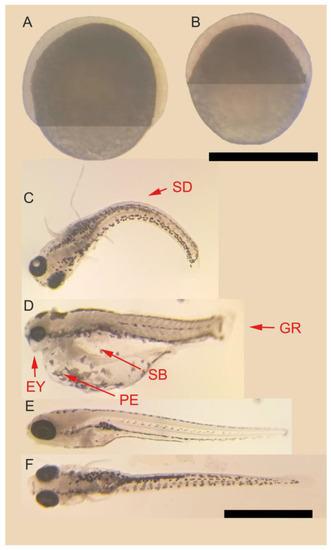
Representative zebrafish embryo epiboly and typical teratogenic effects observed in zebrafish embryos exposed to lemongrass, thyme, and oregano essential oils. Legend: (A) Control group epiboly at 8 hpf. (B) Thyme 25 µg/mL group epiboly at 8 hpf (scale bar 500 μm). (C,D) Fish affected by thyme essential-oil (20 µg/mL) exposure. Arrows and abbreviations indicate the main teratogenic effects observed as spine deformation (SD), small eyes (EY), pericardial edema (PE), swim-bladder inflation (SB), and growth retardation (GR). (E,F) Control group in lateral and dorsal views, respectively (scale bar 1 mm).

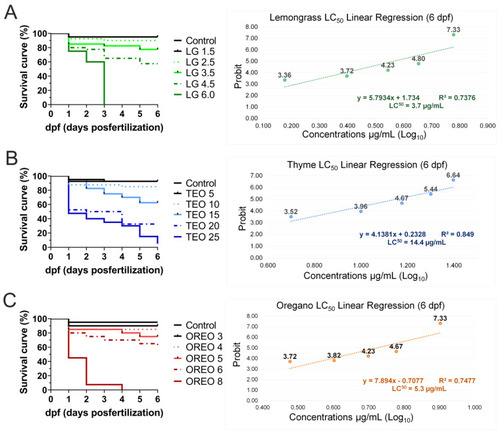
Survival curve and the mortality linear regression of zebrafish embryos after exposure to lemongrass (LGEO), thyme (TEO), and oregano (OREO) essential oils (A, B, and C, respectively). The linear regression and relationship of probit essential-oil concentrations were used to calculate LC50 values in larvae at 6 days post-fertilization.

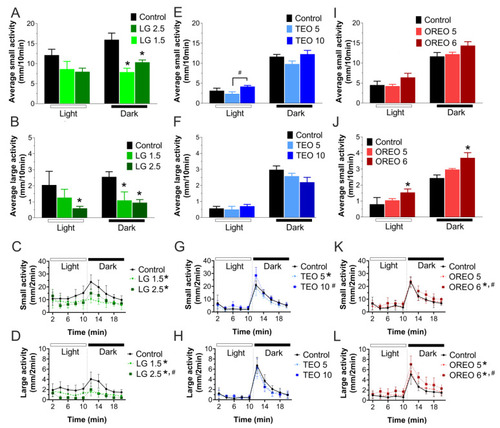
Zebrafish larvae behavior in excitatory dark–light locomotor test. (AF) Bars show the average of small (between 4 and 8 mm/s) or large (>8 mm/s) activity movement for each dark or light period (10 min). (GL) Average swimming behavior (2 min) in each complete dark–light cycle (20 min). Behavior test was analyzed by one-way ANOVA in light period (lemongrass EO small activity (F(2, 15) = 2.273, p = 0.14), large activity (F(2, 15) = 3.943, p < 0.05); thyme EO small activity (F(2, 15) = 3.463, p = 0.06), large activity (F(2, 15) = 0.5043, p = 0.61); oregano EO small activity (F(2, 15) = 1.984, p = 0.17), large activity (F(2, 15) = 4.964, p < 0.05)) and dark period (lemongrass EO small activity (F(2, 15) = 13.10, p < 0.05), large activity (F(2, 15) = 12.77, p < 0.05); thyme EO small activity (F(2, 15) = 2.829, p = 0.09), large activity (F(2, 15) = 2.547, p = 0.11); oregano EO small activity (F(2, 15) = 2.925, p = 0.08), large activity (F(2, 15) = 8.370, p < 0.05)). When the time variable was considered, two-way ANOVA test was realized in small activity: lemongrass EO small activity (F(2, 69) = 9.015, p < 0.05) and large activity (F(2, 69) = 9.924, p < 0.05); thyme EO small activity (F(2, 69) = 1.436, p = 0.24) and large activity (F(2, 69) = 0.456, p = 0.64); oregano EO small activity (F(2, 69) = 1.951, p = 0.15) and large activity (F(2, 69) = 2.746, p = 0.07). * Represents statistically significant (p < 0.05) difference by control group. # Represents statistically significant (p < 0.05) difference by another essential-oil group.

Acknowledgments
This image is the copyrighted work of the attributed author or publisher, and ZFIN has permission only to display this image to its users. Additional permissions should be obtained from the applicable author or publisher of the image. Full text @ Biomedicines