|
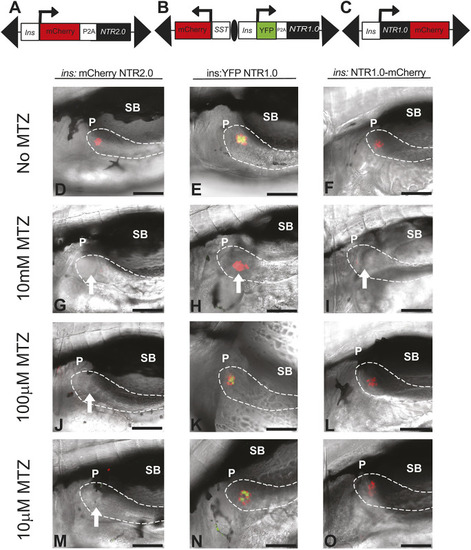
Use of NTR2.0 improves efficacy in ablating β cells. (A-C) Schematic of NTR2.0 (A) and NTR1.0-based transgenes (B,C), with positions of Tol2 arms (black triangles), HS4 insulator (black oval) and promoters (arrows) indicated. (D-O) Larvae were incubated from 3 to 5 dpf (48 h) in MTZ at various concentrations (as indicated) and imaged. White arrows point to the position of ablated β cells. Results from ins:mCherry NTR2.0 larvae (D,G,J,M) compared to both ins:YFP NTR1.0lmc01 (E,H,K,N) and ins:NTR1.0-mCherryjh4 (F,I,L,O) are shown. Only larvae expressing NTR2.0 achieve a complete loss of β cells when treated with 100 µM MTZ (J). Dashed white lines outline the pancreas. All images were taken at 40× (scale bars: 100 µM) with anterior to the left. dpf, days post fertilization; MTZ, metronidazole; NTR, nitroreductase; P, pancreas; SB, swim bladder.
|