FIGURE SUMMARY
Title

A new model of inducible chronic hyperglycemia

Authors
Tucker, T.R., Knitter, C.A., Khoury, D.M., Eshghi, S., Tran, S., Sharrock, A.V., Wiles, T.J., Ackerley, D.F., Mumm, J.S., Parsons, M.J.
Source
Full text @ Dis. Model. Mech.

Use of NTR2.0 improves efficacy in ablating β cells. (A-C) Schematic of NTR2.0 (A) and NTR1.0-based transgenes (B,C), with positions of Tol2 arms (black triangles), HS4 insulator (black oval) and promoters (arrows) indicated. (D-O) Larvae were incubated from 3 to 5 dpf (48 h) in MTZ at various concentrations (as indicated) and imaged. White arrows point to the position of ablated β cells. Results from ins:mCherry NTR2.0 larvae (D,G,J,M) compared to both ins:YFP NTR1.0lmc01 (E,H,K,N) and ins:NTR1.0-mCherryjh4 (F,I,L,O) are shown. Only larvae expressing NTR2.0 achieve a complete loss of β cells when treated with 100 µM MTZ (J). Dashed white lines outline the pancreas. All images were taken at 40× (scale bars: 100 µM) with anterior to the left. dpf, days post fertilization; MTZ, metronidazole; NTR, nitroreductase; P, pancreas; SB, swim bladder.

Testing for transgene silencing. (A-B″) Live confocal images of 5 dpf larvae carrying two transgenes ins:hmgb1-eGFP (labels β-cell nuclei green) and ins:mCherry NTR2.0 (designed for β-cell expression of NTR2.0 and mCherry). Both transgenes mark islet cells in the head of the pancreas (20×, scale bar: 100 µm) (A). Close up of green nuclei (B) and red cytoplasm (B′) and co-expression in β cells (B″), indicating correct β-cell-specific expression of NTR2.0 (40×, scale bar: 10 µm). (C-C″) Confocal images of sections from ins:mCherry NTR2.0 fish with immunofluorescent detection of insulin (to detect β cells, green; C) and mCherry (red, reports on NTR2.0 co-expression; C′); complete colocalization can be seen throughout the islet (C″) (40×, scale bar: 10 µm). a, anterior; d, dorsal; p, posterior; v, ventral.

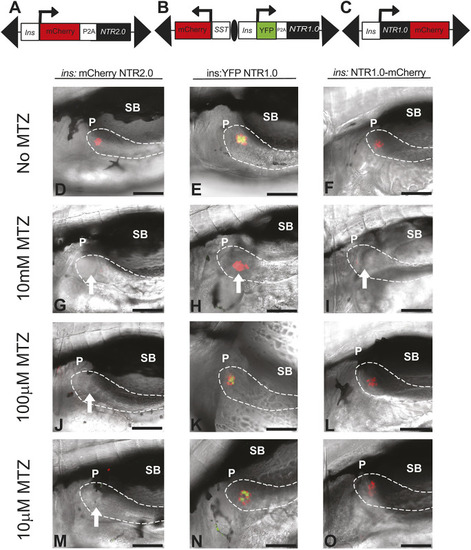
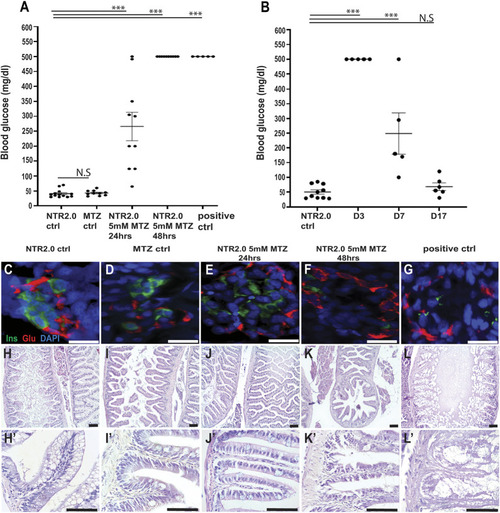
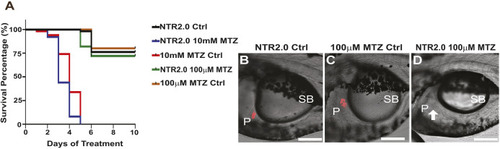
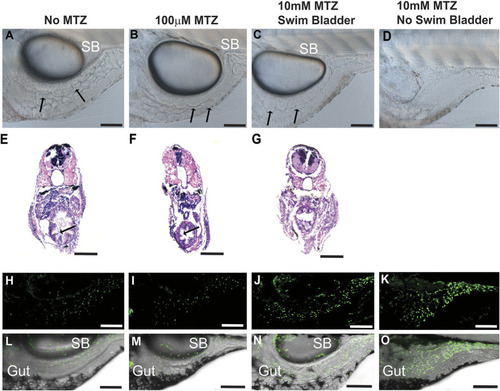
Deleterious effects of 10 mM MTZ on larval zebrafish. (A-O) Images taken from 5 dpf control (0 mM MTZ) larvae (A,E,H,L) or larvae treated from 3 to 5 dpf with either 100 µM MTZ (B,F,I,M) or 10 mM (C,D,G,J,K,N,O). (A,B) Images from the trunk region of casper larvae, showing that control (A) and 100 µM MTZ-treated (B) larvae have discernible gut lumens (complete with normal intestinal folds) as well as inflated swim bladders. (C,D) Surviving larvae treated with 10 mM display less defined gut lumen with few intestinal folds; some larvae have inflated swim bladders (C) and others have no inflated swim bladder (D) (20×, scale bars: 100 µm). (E-G) Transverse sections through the trunk stained with H&E to observe intestinal morphology confirmed a lack of intestinal folds in 10 mM MTZ-treated larvae with an inflated swim bladder (G) (20×, scale bars: 100 µm). (H-O) Images from 8xNFκB:eGFP 5dpf larvae indicate that 10 mM MTZ treatment leads to an increase in the number of cells undergoing NFκB signaling (J,K,N,O) (20×, scale bars: 100 µm). Black arrows point to intestinal folds. MTZ, metronidazole; SB, swim bladder.

10 mM MTZ has toxic effects on larval tissues independent of microbiota. (A-L) Confocal images of CVZ (A-F) and GF (G-L) 8xNFκB:eGFP 5 dpf larvae that were either kept as a negative control (no MTZ, A,D,G,J) or treated with 10 mM MTZ from 3 to 5 dpf (10 mM MTZ, B,C,E,F,H,I,K,L). MTZ-treated larvae either inflated or failed to inflate their swim bladders. Both CVZ and GF larvae showed the same response – an increase in the number of cells undergoing NFκB signaling in the gut, neuromasts (arrowheads) and skin (arrows) when treated with 10 mM MTZ. (A-C,G-I) 20× z-stacked fluorescent images. (D-F,J-L) Same z-stack imposed over brightfield image. Scale bars: 100 µM. CVZ, conventionalized; GF, germ free; MTZ, metronidazole; SB, swim bladder.

Acute β-cell ablation in adults by MTZ immersion. (A) FBG readings from five groups of adult fish: untreated ins:mCherry NTR2.0ir2018 fish (NTR control), wild-type fish immersed in 5 mM MTZ for 24 h (MTZ control), ins:mCherry NTR2.0ir2018 fish immersed for either 24 h or 48 h in 5 mM MTZ (NTR2.0 5 mM MTZ 24 h or 48 h), and ins:mCherry NTR2.0ir2018 fish immersed in 10 mM MTZ for 24 h (positive control). Owing to the limitation of the blood glucose meter used, 500 mg/dl is the maximum FBG reading that can be captured. (B) FBG readings of NTR2.0 control and ins:mCherry NTR2.0ir2018 fish. The NTR2.0 fish were treated with 5 mM MTZ for 48 h and were then allowed to recover for either 3, 7 or 17 days, after which FBG measurements were taken. N.S., not significant; ***P<0.05 (unpaired two-tailed Student's t-test). (C-G) Confocal images of paraffin sections through the pancreas after immunofluorescent detection for the islet markers insulin (green) and glucagon (red). Nuclei were counterstained with DAPI (blue) (40×, scale bars: 10 µm). (H,I,J,K,L) H&E histological analysis of intestines from fish in each treatment group (20×, scale bars: 100 µm). (H′,I′,J′,K′,L′) Magnification of same images at 60× (scale bars: 50 µm). ctrl, control; D, day; FBG, fasting blood glucose; MTZ, metronidazole; NTR, nitroreductase.

Chronic hyperglycemia can be achieved in larvae using NTR2.0 fish. (A) Survival curve: ins:mCherry NTR2.0ir2018 larvae treated for 10 days (3 dpf to 13 dpf) with no MTZ (NTR2.0 Ctrl), 100 µM MTZ (NTR2.0 100 µM MTZ) or 10 mM MTZ (NTR2.0 10 mM MTZ). Other controls included ins:dsRedm1018 larvae treated with 10 mM MTZ (10 mM MTZ Ctrl) and 100 µM MTZ (100 µM MTZ Ctrl). (B,C) Confocal images (each a single optical section) showing the presence of fluorescently labeled β cells in the trunk region of 13 dpf control larvae: NTR2.0 Ctrl (B) and 100 µM MTZ Ctrl (C). (D) β cells are not detected (white arrow) in NTR2.0 100 µM MTZ larvae, indicating that this treatment is sufficient to ablate β cells and prevent the regeneration new β cells. Scale bars: 100 µm. Anterior to the left, dorsal at the top. P, pancreas; SB, swim bladder.

Chronic hyperglycemia can be achieved in adults using NTR2.0 fish. (A) Timeline of the chronic MTZ treatment trial. (B) Blood glucose readings of individual adult zebrafish from the following groups: negative controls (wild type, no MTZ, -ve. ctrl), MTZ controls (wild type with MTZ, MTZ ctrl) and three experimental groups (ins:mCherry NTR2.0ir2018 fish treated with MTZ as outlined in A, Expt. 1-3). All fish in the experimental groups became hyperglycemic. Owing to the limitation of the blood glucose meter used, 500 mg/dl is the maximum blood glucose reading that can be captured. (C) Percentage change in body weight over the course of the trial for individual fish in control and experimental groups. The dotted line represents no change in body weight. (D-M) Representative images of female and male fish from control and experimental groups. Scale bars: 1 cm. N.S., nonsignificant; ***P<0.05 (unpaired two-tailed Student's t-test). FBG, fasting blood glucose; MTZ, metronidazole.

Acknowledgments
This image is the copyrighted work of the attributed author or publisher, and ZFIN has permission only to display this image to its users. Additional permissions should be obtained from the applicable author or publisher of the image. Full text @ Dis. Model. Mech.