|
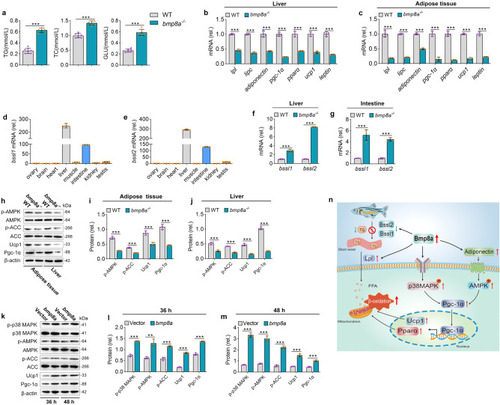
Bmp8a promotes fatty acid oxidation through AMPK and p38 MAPK pathways. a The serum TG, TC and GLU level in WT and bmp8a-/- zebrafish (n = 6). b, c The qPCR analysis of genes related to fatty acid metabolism in the WT and bmp8a-/- zebrafish liver (b, n = 3) or adipose tissue (c, n = 3). d, e The bssl1 (d) and bssl2 (e) gene expression analysis in different zebrafish tissues (n = 3). f, g The qPCR analysis of bssl1 and bssl2 mRNA level in the liver (f, n = 3) and intestine (g, n = 3) from WT or bmp8a-/- zebrafish. h–j Validation and quantification of p-AMPK, p-ACC, Ucp1, and Pgc-1α expression in adipose tissue (i) and liver (j) from WT or bmp8a-/- zebrafish. Protein expression levels were quantified using ImageJ software and normalized to total protein or β-actin (n = 3). k–m Validation and quantification of p-p38 MAPK, p-AMPK, p-ACC, Ucp1, and Pgc-1α expression after overexpression of zebrafish bmp8a in ZFL cells. The cells were collected at 36 h (I) and 48 h (m) post-transfection for Immunoblot analysis. Protein expression levels were quantified using ImageJ software and normalized to total protein or β-actin (n = 3). n Schematic overview. Data were representative of at least three independent experiments. Data were analyzed by two-tailed Student’s t-test and presented as mean ± SD (**p < 0.01, ***p < 0.001).
|