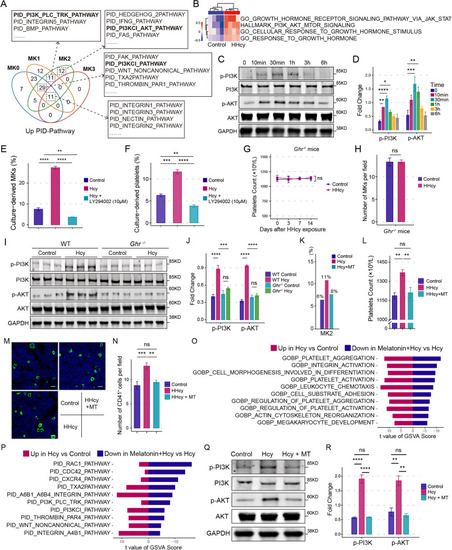
Hcy promotes MKs differentiation via GH-PI3K-Akt axis. A Venn diagram visualizing the elevated Pathway Interaction Database pathways of MKs subpopulations in Hcy group. B Heatmap showing the relative GSVA scores for each gene set based on bulk RNA-seq of BM MKs (n = 4). C and D Western blot analysis of p-PI3K and p-AKT (Ser473) in Meg-01 cells after exposure to Hcy (100 μM) for indicated time period. Total PI3K, AKT and GAPDH were used as loading control. Significance according to one-way ANOVA with LSD multiple comparisons test (n = 3). E Culture-derived MKs and F platelets were analyzed by flow cytometry. Significance according to one-way ANOVA with Tukey multiple comparisons test (n = 3). G PLT in Ghr−/− mice. Significance according to two-tailed unpaired t test (n = 6). H Quantification of CD41+ MKs in femurs bone marrow of Ghr−/− mice. Significance according to Mann–Whitney test (n = 6). I and J Western blot analysis of p-PI3K and p-AKT (Ser473) in the bone marrow MKs after exposure to Hcy (100 μM) for 30 min. Significance according to one-way ANOVA with Tukey multiple comparisons test (n = 6). K Bar diagram showing the percentage of MK2 to all cells. L Peripheral PLT. Significance according to one-way ANOVA with Tukey multiple comparisons test (n = 8). M Representative images and N quantification of CD41+ MKs (green) in femurs bone marrow of mice. Scale bars, 50 μm. Significance according to one-way ANOVA with Tukey multiple comparisons test (n = 8). O Bar chart showing the significantly down-regulated GO-BP terms and P PID pathways in MKs. T values are from the linear model in the limma package. Q–R Western blot analysis the level of p-PI3K and p-AKT (Ser473) in Meg-01 cells after exposure to Hcy (100 μM) with or without MT (1 μM) for 30 min. Significance according to one-way ANOVA with Tukey multiple comparisons test (n = 3). *p < 0.05, **p < 0.01, ***p < 0.001, ****p < 0.0001, ns not significant
|
