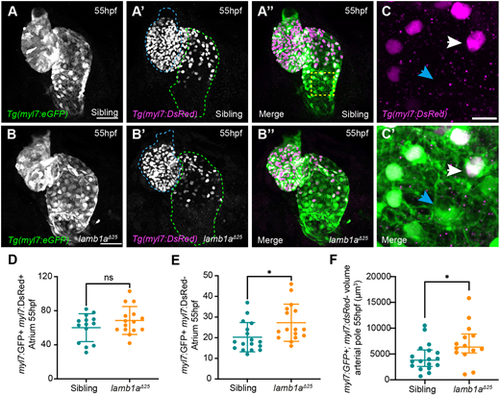
Lamb1a limits SHF addition to the venous pole. (A-B″) Maximum intensity projections of confocal image z-stacks in Tg(myl7:eGFP);Tg(myl7:DsRed) double-transgenic sibling (A-A″) and lamb1aΔ25 mutant embryos (B-B″) at 55 hpf. GFP+;DsRed−SHF cells are visible at the venous (green dotted line) and arterial (blue dotted line) poles of the heart. (C,C′) Higher magnification of the dashed-yellow-boxed area in A″. Double GFP+;DsRed+ cells represent ‘older’ cardiomyocytes (white arrow), whereas GFP+;DsRed− cells represent newly added SHF cells (blue arrowheads). (D,E) Quantification of double GFP+;DsRed+ cardiomyocytes (D) and GFP+;DsRed− SHF cells (E) in the atrium of siblings (n=17) and lamb1aΔ25 mutants (n=16) at 55 hpf reveals an increase in newly added SHF cells in lamb1aΔ25 mutants compared with siblings. Data are mean±s.d., analysed with the Kolmogorov–Smirnov test. (F) Quantification of GFP+;DsRed− myocardial volume in the distal arterial pole in sibling (n=18) and lamb1aΔ25 mutant embryos (n=14) at 55 hpf reveals an increase in SHF myocardium in lamb1aΔ25 mutants compared to controls. Data are median±interquartile range, analysed with Welch's t-test; *=P<0.05, ns=not significant in all graphs. Scale bars: 10 μm in C; 50 μm in A,B.
|
