
Fig. 3
- ID
- ZDB-FIG-230717-135
- Publication
- Truchado-García et al., 2022 - A small change with a twist ending - a single residue in EGF-CFC drives Bilaterian asymmetry
- Other Figures
- All Figure Page
- Back to All Figure Page
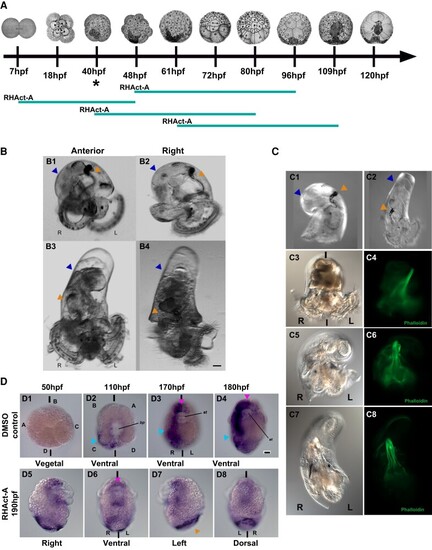
Cfo-nodalB regulates the establishment of LRA, whereas Activin inhibits the Nodal pathway in Crepidula fornicata. (A) Diagram of the windows used on RHAct-A treatment. The teal bar represents the time in which the embryos were cultured in RHAct-A, and the asterisk indicates when nodalB expression first starts; hpf, hours post fertilization. (B) Overexpression of Cfo-nodalB, in a 2-week-old hatched veliger. (B1) Anterior and (B2) right views of a control veliger; (B3) anterior and (B4) right views of a veliger after Cfo-nodalB injection. (C) RHAct-A treatment, in a 2-week-old hatched veliger. Right view of a (C1) control veliger and (C2) a treated veliger. (C3–C8) Three individuals with different grades of coiling after treatment. Brightfield of (C3) coiled DMSO control, (C5) hemitorsioned, and (C7) straight larvae after RHAct-A. (C4/C6/C8): note the change of the retractor muscle of those same larvae (C3, C5, C7) shown by phalloidin stain. In both B and C, note the bilateral symmetry phenotype in B3, B4 and C2, C7. L, left; R, right; shell coiling, blue arrowhead; gut coiling, orange arrowhead. (D) Spatio-temporal localization of Pitx mRNA by WISH, in RHAct-A treated C. fornicata embryos. (D1–D4) Control embryos in vegetal/ventral view in four stages during development. D1, non-stained blastula (50 hpf); D2, mid-gastrula (110 hpf); D3, organogenesis (170 hpf); D4, preveliger larva (180 hpf). Note the right-side staining (cyan arrowhead) and the symmetrical staining (pink arrowhead) on the anterior region and stomodeum (D2–D4). (D5–D8) Views of a preveliger, post-RHAct-A exposure. Note that the symmetrical expression remains (pink arrowhead), whereas the asymmetrical expression is lost on the right side; shell gland, orange arrowhead. st, stomodeum; bl, blastopore; L, left; R, right. A, B, C and D indicate the quadrants; bilateral axis is represented by the vertical bars. Scale bars correspond to 30 μm. |