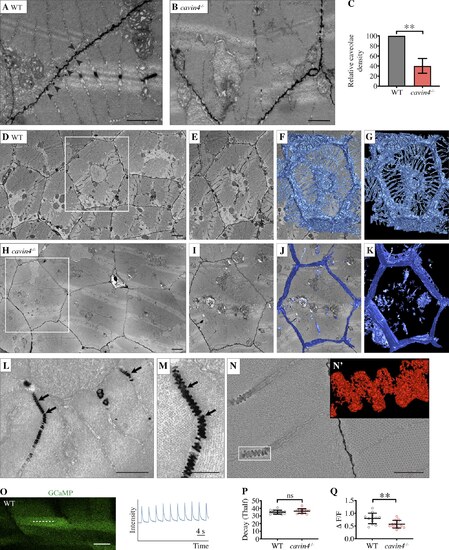
EM reveals T-tubule irregularities in cavin4−/− zebrafish muscle, which are associated with a reduced Ca2+ response to muscle contraction. (A and B) Ultrastructure of 5-dpf WT (A) and cavin4−/− (B) embryos. Normal sarcomeric T-system structure was observed in WT muscle; arrowheads highlight abundant caveolae. Few caveolae were observed in cavin4−/− muscle. Scale bars: 1 µm. (C) Relative caveolae density was 40.3 ± 14.7% in muscle from 5-dpf cavin4−/− embryos (compared with WT; two-tailed t test). **, P ≤ 0.01. Quantitation performed on randomly selected images from three embryos from three different clutches. (D–K) Single sections showing skeletal muscle ultrastructure from a 5-dpf WT (D) and cavin4−/− zebrafish embryo (H). A single muscle fiber from each WT and cavin4−/− section was chosen (E and I, boxed areas in D and H, respectively), and density-based thresholding was used to segment T-tubules. 3D reconstruction highlights normal radial distribution of T-tubules in WT muscle (F and G) and abnormal T-tubule morphology in cavin4−/− muscle (J and K). Scale bars: 2 µm. (L and M) Remaining T-tubules in cavin4−/− muscle fibers had caveolar structure (arrows). Scale bars: 1 µm. (N) 3D reconstruction of T-tubule area from cavin4−/− muscle. Inset (N') represents boxed area. Scale bar: 500 nm. See also Video 1. (O) Confocal image of GCaMP expression in WT zebrafish muscle, with line scan measurement (dashed line) of GCaMP intensity in response to electrical stimulation (GFP intensity [y axis] over time [seconds, x axis]). Scale bar: 20 µm. (P and Q) Quantitation of GCaMP signal in response to electrical stimulation measured as half-life (Thalf) decay (P) and amplitude (Q, ΔF/F) in WT and cavin4−/− muscle fibers (two-tailed t test). **, P ≤ 0.01. Values for individual embryos shown as colored circles (n = 6, 5, and 2 each of WT and cavin4−/− embryos from three independent clutches, with an average of at least three fiber measurements per embryo). Error bars represent mean ± SD.
|
