
FIGURE
Fig. 2
- ID
- ZDB-FIG-230710-44
- Publication
- Hadzhiev et al., 2023 - The miR-430 locus with extreme promoter density forms a transcription body during the minor wave of zygotic genome activation
- Other Figures
- All Figure Page
- Back to All Figure Page
Fig. 2
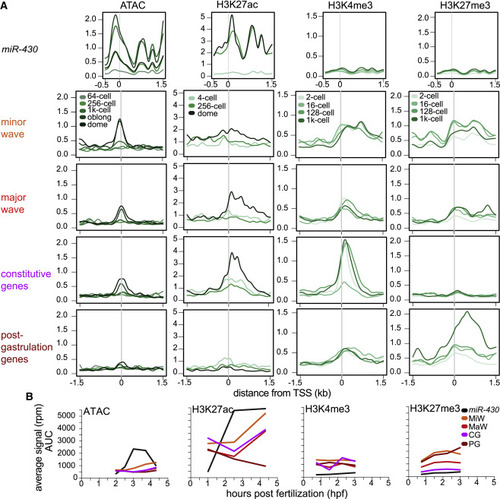
Epigenomic features of miR-430 cluster compared with other gene sets activated at distinct phases of embryo development (A) Aggregation plots showing signal distribution (mean) around the TSS for different gene sets (left side labels) and epigenetic features (top labels). (B) Line graphs of total epigenetic signal. The miR-430 data were multi-mapped (black) and not directly comparable to the other presented gene sets, which are unique mapped (color). See also Figure S2 and Table S2. |
Expression Data
Expression Detail
Antibody Labeling
Phenotype Data
Phenotype Detail
Acknowledgments
This image is the copyrighted work of the attributed author or publisher, and
ZFIN has permission only to display this image to its users.
Additional permissions should be obtained from the applicable author or publisher of the image.
Reprinted from Developmental Cell, 58, Hadzhiev, Y., Wheatley, L., Cooper, L., Ansaloni, F., Whalley, C., Chen, Z., Finaurini, S., Gustincich, S., Sanges, R., Burgess, S., Beggs, A., Müller, F., The miR-430 locus with extreme promoter density forms a transcription body during the minor wave of zygotic genome activation, 155170.e8155-170.e8, Copyright (2023) with permission from Elsevier. Full text @ Dev. Cell