
- Title
-
The miR-430 locus with extreme promoter density forms a transcription body during the minor wave of zygotic genome activation
- Authors
- Hadzhiev, Y., Wheatley, L., Cooper, L., Ansaloni, F., Whalley, C., Chen, Z., Finaurini, S., Gustincich, S., Sanges, R., Burgess, S., Beggs, A., Müller, F.
- Source
- Full text @ Dev. Cell
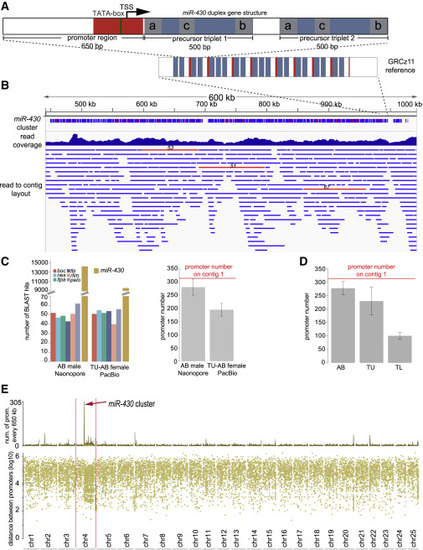
De novo assembly of the miR-430 cluster from long-read sequencing data (A) Schematic of the most common miR-430 gene structure (top), the duplex consisting of promoter region (red) and two pre-miRNA triplets (blue) each containing miR-430a, miR-430b, and miR-430c (gray) pre-miR-430 subtypes. Bottom: the miR-430 gene cluster structure in current reference assembly (GRCz11). (B) Genome browser view of the miR-430 gene cluster assembled from long reads. The tracks show a low-resolution continuity structure of the gene cluster (top), long-read coverage histogram (middle), and the read to contig assembly layout (bottom). Raw reads with 50 or more promoters are shown as red horizontal bars with the promoter number indicated on top of them. (C) Left: number of BLAST hits in raw long reads of single gene promoters and miR-430. Right: estimated miR-430 promoter number normalized to that of single-copy genes. (D) Estimated miR-430 promoter number (red line) by digital droplet PCR (ddPCR) for three zebrafish strains and the assembled contig. Error bars are standard deviation from the mean of the miR-430 promoter estimate normalized to each of the 6 single-copy genes and 6 technical ddPCR replicates respectively. (E) Rainfall plot representing the promoter density across each chromosome of the newly assembled zebrafish genome (GRCz11 reference guided). Red arrow indicates the mirR-430 gene cluster. Abbreviations: TSS, transcription start site; AB, TU-AB, TU, and TL are zebrafish strains used in (C) and (D). See also Figure S1 and Tables S1 and S5. |
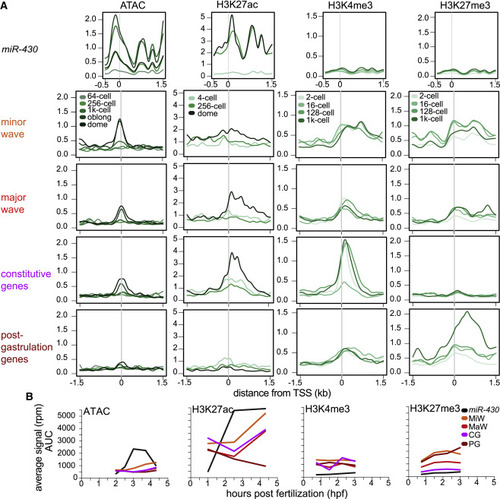
Epigenomic features of miR-430 cluster compared with other gene sets activated at distinct phases of embryo development (A) Aggregation plots showing signal distribution (mean) around the TSS for different gene sets (left side labels) and epigenetic features (top labels). (B) Line graphs of total epigenetic signal. The miR-430 data were multi-mapped (black) and not directly comparable to the other presented gene sets, which are unique mapped (color). See also Figure S2 and Table S2. |
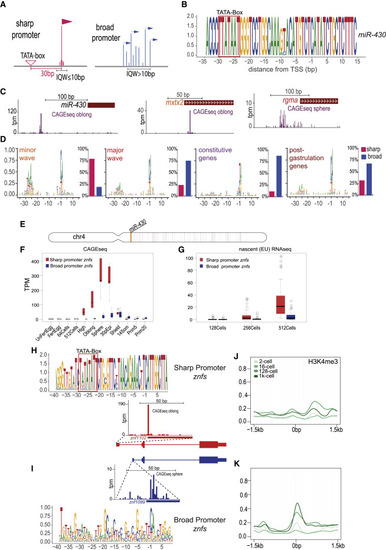
Promoter architecture features of minor and main wave ZGA genes (A) Schematic comparing sharp and broad promoter architectures. (B) Sequence logo of 80 miR-430 genes showing the −35 to +15 region relative to the dominant TSS. (C) Genome browser views showing promoter shape as defined by CAGE-seq signal for miR-430, and example genes for the minor (mxtx2) and the major (rgma) wave gene sets. (D) Promoter architecture comparison between the 4 gene sets. Left: sequence logos of the −35 to +15 region relative to the TSS, right: percentage of the genes with sharp (red) and broad (blue) promoter in each gene set, determined by the IQW of the corresponding CAGE consensus cluster as demonstrated (A). (E) Chromosomal plot showing the location of sharp (red) and broad (blue) promoter znfs on chr4 and the location of the miR-430 cluster (orange). (F and G) Expression activity of sharp and broad promoter znfs determined by CAGE-seq (F) and EU nascent RNA-seq (G). (H and I) Comparison of the promoter motifs/architecture of the sharp (H) and broad (I) znfs. (J and K) Distribution of H3K4me3 signal around the promoter for the sharp (K) and broad (J) znfs. Abbreviations: TSS, transcription start site; IQW, interquantile width. |
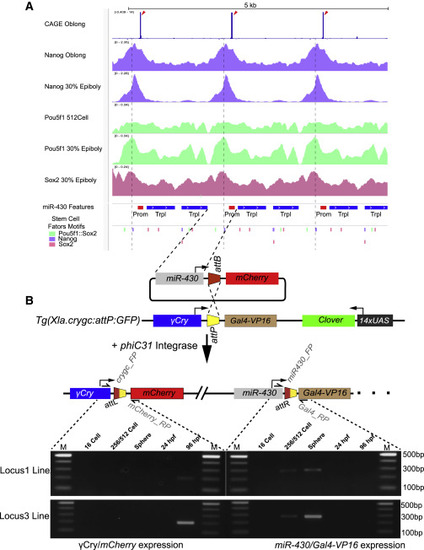
A single copy of the miR-430 promoter including stem cell transcription-factor-binding sites is sufficient to activate reporter expression during the minor wave of genome activation (A) Browser views showing CAGE-seq signal (top track, blue bar) marking the position of the TSS (red arrowheads). ChIP-seq signal of Nanog (purple), Pou5f1 (green), and Sox2 (pink) are shown below. Bottom annotation tracks show the miR-430 gene features, with the core promoter (red), the precursor triplet (blue), and the position of predicted pluripotency-factor-binding sites. Purple dash line marks the Nanog binding site in the core promoter region close to the peak of the Nanog ChIP-seq signal. (B) Top: schematic of the generation of miR-430 promoter-containing stable transgenics reporter lines using the PhiC31 site specific integration system. Bottom: expression of the reporter miR-430 promoter (left) and γ-crystalline promoter (right), detected by RT-PCR at the indicated stages. Abbreviations: TSS, transcription start site; γ-Cry, γ-crystalline C. See also Figure S3. |
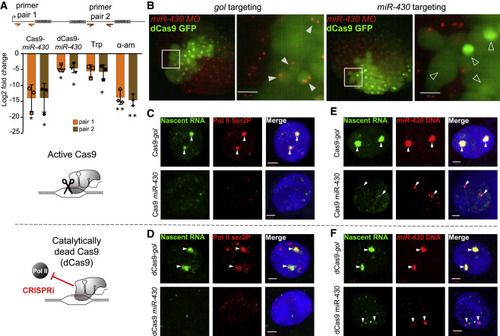
Manipulations that limit transcription of the miR-430 cluster also disrupt the transcription body (A) Schematic of a single miR-430 triplet showing the position of two qRT-PCR primer sets (orange and brown arrows). Chart shows relative levels of miR-430 RNA at the 512-cell stage, normalized to 5S rRNA, following miR-430 promoter targeting by Cas9 or dCas9, and triptolide (Trp) or α-amanitin (α-am) treatment, compared with control manipulations of active Cas9 targeting gol splice junction, dCas9 targeting gol splice junction and injection control, respectively. Data are based on three biological repeats. Error bars represent standard deviation and asterisks indicate significance, ∗p < 0.05 and ∗∗p < 0.005 (unpaired t test). (B) miR-430 MO (red) labeled transcription bodies in live 512-cell stage embryos following either miR-430 promoter or gol splice junction mosaic targeting with dCas9-GFP (green). Gray boxes indicate enlarged region shown on the right; gol targeted: 10 embryos, miR-430 targeted: 8 embryos. white arrowheads: nuclei with two transcription bodies, open arrowheads: nuclei without detectable transcription bodies, scale bars, 20 μm. (C and D) EU labeling of nascent RNA (green), Pol II ser2P (red) immunostaining, and DAPI (blue) in 512-cell-stage embryos: active Cas9; gol targeted: 6 embryos, 31 nuclei; miR-430 targeted: 6 embryos, 28 nuclei (C). Catalytically dead Cas9; gol targeted: 8 embryos, 52 nuclei; miR-430 targeted: 5 embryos, 29 nuclei (D). (E and F) EU labeling of nascent RNA (green) combined with FISH for miR-430 DNA (red) and DAPI (blue) at 512-cell stage: active Cas9; gol targeted: 4 embryos, 21 nuclei. miR-430 targeted: 4 embryos, 41 nuclei (E). Catalytically dead Cas9; gol targeted: 5 embryos, 41 nuclei. miR-430 targeted: 8 embryos, 66 nuclei (F). White arrowheads (C–F) remnants of transcription body, scale bars, 2 μm. See also Figure S4. |

miR-430 manipulations do not influence early zygotic transcription of minor wave genes on other chromosomes (A) Nascent RNA (green) combined with FISH for klf17 DNA (red) and DAPI (blue) in WT 512-cell stage embryos counter-stained with DAPI (blue). 59 nuclei from 16 embryos. Right, chart shows frequency of colocalization frequency between klf17 DNA or RNA and major nascent RNA accumulation (transcription body) in 3D space (59 and 54 nuclei, respectively). (B) Double DNA-FISH labeling the miR-430 cluster (green) and the klf17 locus on chr2 (red) in WT 512-cell embryos counter-stained with DAPI (blue). 51 nuclei from 8 embryos. Chart shows frequency of colocalization between klf17 DNA and miR-430 DNA in 3D space. White arrowheads indicate klf17 locus, open arrowheads (A and B) indicate the miR-430 transcription body in (A) and (B). (C and D) Change in expression in WT 512-cell stage embryos, following manipulations, for miR-430 normalized to 5S rRNA (C), and klf17 normalized to TBP mRNA (D). Charts show mean log2(fold change) between Cas9/dCas9 targeting a control vs. targeting miR430, or α-amanitin treatment compared with injection control, from 4 biological repeats. (E) Nascent miR-430 (top) or klf17 RNA (bottom) staining at 512-cell following manipulations. Numbers indicate frequency of staining pattern, scale bars, 5 μm. (F and G) Relative change in expression, in Tg(Xla.crygc:attP-Gal4vp16,14UAS:Clover)UoBL1 embryos, at the 512-cell stage, following manipulations, for miR-430 RNA, normalized to 5S rRNA (F), or gal4 RNA normalized to TBP mRNA (G). Charts show mean log2(fold change) between Cas9 (n = 3 biological repeats) or dCas9 (n = 4) targeting, a control vs. targeting miR-430, or α-amanitin treatment compared with injection control. (C, D, F, and G) Error bars represent standard deviation and asterisks indicate significance: ns, p > 0.05, ∗p < 0.05, ∗∗p < 0.005 and ∗∗∗p < 0.0005 (unpaired t test). See also Figures S5 and S6. |

Models of minor wave gene activation in and outside of the miR-430 transcription body (A) The miR-430 cluster on chr4 with high promoter density forms a microenvironment during the minor wave of ZGA. Minor wave gene activation occurs distal to the transcription body, such as at the gata3 and klf17 loci, which share promoter architecture features with miR-430 gene but are activated independently from the transcription body (top). Genes that have distinct promoter features from minor wave genes are not activated until the major wave of ZGA (bottom), while minor wave genes continue to function during the major wave of ZGA. |
Reprinted from Developmental Cell, 58, Hadzhiev, Y., Wheatley, L., Cooper, L., Ansaloni, F., Whalley, C., Chen, Z., Finaurini, S., Gustincich, S., Sanges, R., Burgess, S., Beggs, A., Müller, F., The miR-430 locus with extreme promoter density forms a transcription body during the minor wave of zygotic genome activation, 155170.e8155-170.e8, Copyright (2023) with permission from Elsevier. Full text @ Dev. Cell