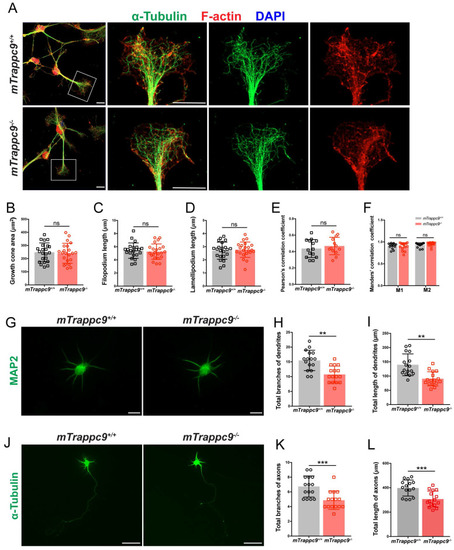
The length and branches of nerve tracts are reduced after Trappc9 deficiency in vitro. (A-F), F-actin and α-tubulin immunostaining of mouse NSC-differentiated neurons cultured for 6 days. (B) Growth cone size; (C) length of filopodium; (D) length of lamellipodium; (E) /(F) Pearson's/Manders' correlation coefficient of F-actin and α-tubulin in growth cone, respectively. mTrappc9m/m mouse neuronal growth cones had normal morphology. Representative images from n=3 coverslips/group (A); n=22 growth cones (B-D); n=14 growth cones (E-F). (G-I), Dendrites of primary neurons from E17.5 mouse cerebral cortex cultured for 6 days labeled by MAP2. Both total branch points (H) and total lengths (I) of dendrites were significantly reduced in mTrappc9m/m neurons. Representative images from n=4 coverslips/group (G); n=16 neurons (H, I). (J-L), Axons of primary neurons from E17.5 mouse cerebral cortex cultured for 6 days labeled by α-tubulin. Both total branch points (K) and total length (L) of axons were significantly reduced in mTrappc9m/m neurons. Representative images from n=4 coverslips/group (J); n=15 neurons (K, L). Data are means ± SEM; t-tests (B, C, D, E, H, I, K, L); Two-way ANOVA (F); ***P≤0.001; **P≤0.01; ns, not significant (P>0.05). Scale bars: 10 μm (A, G); 50 μm (J).
|
