
- Title
-
Defective neurite elongation and branching in Nibp/Trappc9 deficient zebrafish and mice
- Authors
- Hu, M., Bodnar, B., Zhang, Y., Xie, F., Li, F., Li, S., Zhao, J., Zhao, R., Gedupoori, N., Mo, Y., Lin, L., Li, X., Meng, W., Yang, X., Wang, H., Barbe, M.F., Srinivasan, S., Bethea, J.R., Mo, X., Xu, H., Hu, W.
- Source
- Full text @ Int. J. Biol. Sci.

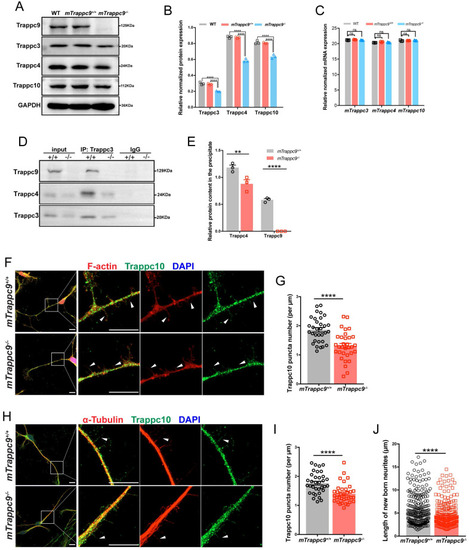
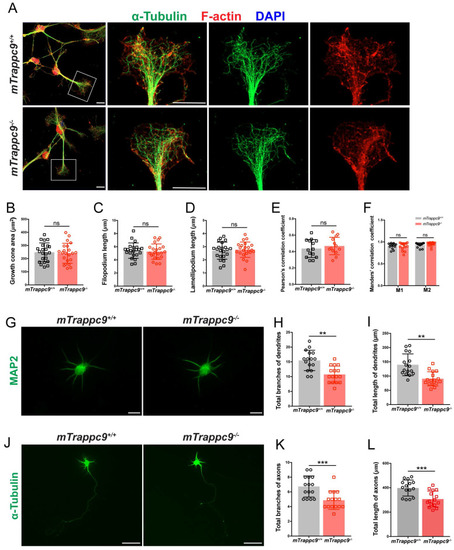
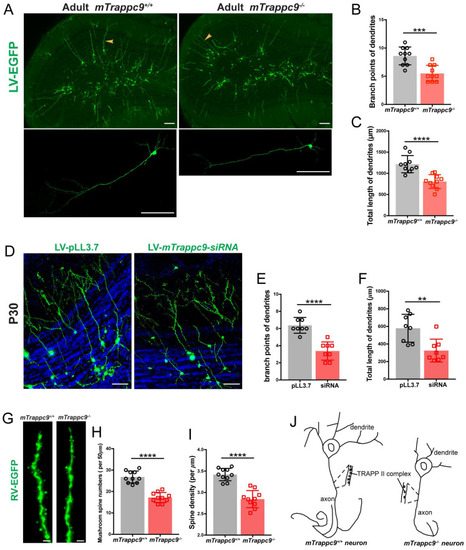
ZFIN is incorporating published figure images and captions as part of an ongoing project. Figures from some publications have not yet been curated, or are not available for display because of copyright restrictions. |
|
EXPRESSION / LABELING:
PHENOTYPE:
|
EXPRESSION / LABELING:
PHENOTYPE:
|
|
|
|
|