
Fig. 1
- ID
- ZDB-FIG-230706-20
- Publication
- van der Stoel et al., 2022 - Vinculin strengthens the endothelial barrier during vascular development
- Other Figures
- All Figure Page
- Back to All Figure Page
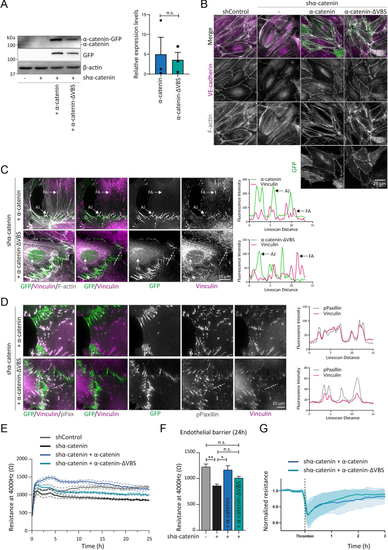
Junctional vinculin strengthens the endothelial barrier in vitro. (A) Representative Western blot analysis of shControl and shα-catenin transduced HUVECs rescued with lentiviral expression of α-catenin–GFP or α-catenin–∆VBS–GFP. Blotted for α-catenin, GFP or β-actin. Bar graphs indicate the average ± s.e. expression levels of α-catenin–GFP and α-catenin–ΔVBS–GFP in shα-catenin-transduced HUVECs relative to endogenous α-catenin levels in shControl HUVECs. n.s., non-significant (non-parametric Wilcoxon matched-pairs signed-rank test). Data are from three independent experiments. (B) Representative immunofluorescent images of shControl and shα-catenin-transduced HUVECs rescued with lentiviral expression of α-catenin–GFP or α-catenin–∆VBS–GFP. Stained for F-actin (grey) and VE-cadherin (magenta). (C) Representative IF images of shα-catenin HUVECs rescued with α-catenin–GFP or α-catenin–∆VBS–GFP (green) that were stained for vinculin (magenta) and F-actin (grey). Colocalisation of vinculin with α-catenin–GFP or α-catenin–ΔVBS–GFP was analysed by line scans displaying signal intensity (arbitrary units) across the AJs and FAs as indicated. Scale bar, 10 µm. (D) Representative IF images of shα-catenin HUVECs rescued with α-catenin–GFP or α-catenin–∆VBS–GFP (green) that were stained for vinculin (magenta) and phosphor-Paxillin Tyr118 (grey). Colocalisation of vinculin with pPaxillin was analysed by line scans displaying signal intensity (arbitrary units) across FAs as indicated. Scale bar, 10 µm. (E) Line graph showing the average resistance ± s.e. measured with ECIS at 4000 Hz of indicated endothelial monolayers over time. Data are from three independent experiments. (F) Bar graphs representing the average resistance ± s.e. measured with ECIS at 4000 Hz of indicated endothelial monolayers after 24 h. Data are from three independent experiments. n.s., non-significant, *P < 0.05, **P < 0.01, ***P < 0.001 (one-Way ANOVA with Tukey’s post hoc test for multiple comparisons). (G) Line graph showing the average resistance ± s.d. measured with ECIS at 4000 Hz of indicated endothelial monolayers over time following treatment with the permeability factor thrombin. Data are normalised to the baseline values prior to thrombin treatment and are derived from two independent experiments. |