
Fig 5
- ID
- ZDB-FIG-230622-35
- Publication
- Shamipour et al., 2023 - Yolk granule fusion and microtubule aster formation regulate cortical granule translocation and exocytosis in zebrafish oocytes
- Other Figures
- All Figure Page
- Back to All Figure Page
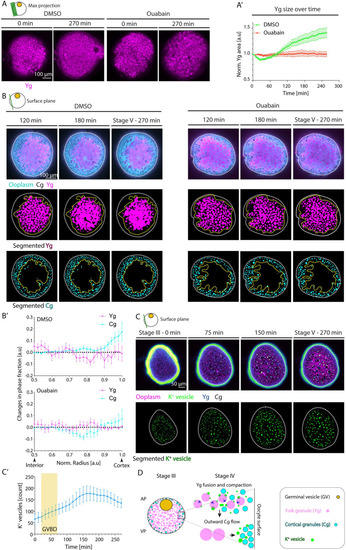
(A) Maximum fluorescence intensity projection of oocytes exposed to DMSO (left) or Ouabain (right) and Lysotracker for labeling Ygs before (stage III) and 270 min after maturation onset. (A’) Average Yg cross-sectional area normalized to its value at stage III as a function of time during oocyte maturation for oocytes exposed to DMSO (green, N = 3 experiments, n = 15 oocytes) or Ouabain (red, N = 3, n = 14). See Table A in S5 Data for underlying data. (B) Fluorescence images of DMSO-treated (left panels) and Ouabain-treated (right panels) stage III Tg(hsp:clip170-GFP) oocytes labeling ooplasm (cyan) and exposed to Lysotracker to mark Yg (magenta) and Cgs (black, identified by their exclusion of both Clip-170-GFP and Lysotracker) at 120, 180, and 270 min after maturation onset (top rows). Images in the middle and bottom rows show segmented Yg and Cg, respectively, obtained from the images in the first rows. White dashed lines mark the oocyte outline. Yellow dashed lines denote the initial distribution of Yg in the middle rows and the final distribution of Cg in the bottom rows. (B’) Changes in phase fractions of Yg (magenta) and Cg (cyan) for oocytes exposed to DMSO (top, N = 3, n = 9) or Ouabain (bottom, N = 2, n = 8) between 120 and 270 min after maturation onset. Normalized (norm) radii of 0.5 and 1 correspond to the oocyte interior and cortex, respectively. See Table B in S5 Data for underlying data. (C) Top row: Fluorescence images of stage III oocytes injected with K+ indicator (K+-Green, green) and Dextran Alexa Fluor 647 to mark ooplasm (magenta) before (stage III) and 75, 150, and 270 min after maturation onset. Cgs (black) are identified by their exclusion of both Dextran and K+-Green. The vesicles enriched with K+ fused with each other and with Yg, thereby increasing their internal K+ concentration and hence becoming dark blue (in Green-Fire-Blue Lookup Table). Bottom row: Segmented K+ vesicles identified from the images in the top row. White dashed lines mark the oocyte outline. (C’) Number of K+ vesicles in superficial stacks of the oocyte as in (C) as a function of time (N = 2, n = 8). Yellow box indicates the period during which GVBD takes place. See Table C in S5 Data for underlying data. (D) Schematic summarizing the role of Yg fusion in ooplasmic reorganizations during zebrafish oocyte maturation. GVBD leads to Yg fusion and compaction by triggering a Na+/K+ ATPase-dependent increase in the concentration of K+ within Yg. The fusion and compaction of Yg to the oocyte center, in turn, leads to ooplasm flows directed towards the oocyte surface. These ooplasmic flows, in turn, carry along Cg, thereby moving them closer to the cortex. Schematics in each panel demarcate the imaging plane used for obtaining the images in that panel. Error bars, SEM. Cg, cortical granule; GVBD, germinal vesicle breakdown; Yg, yolk granule. |