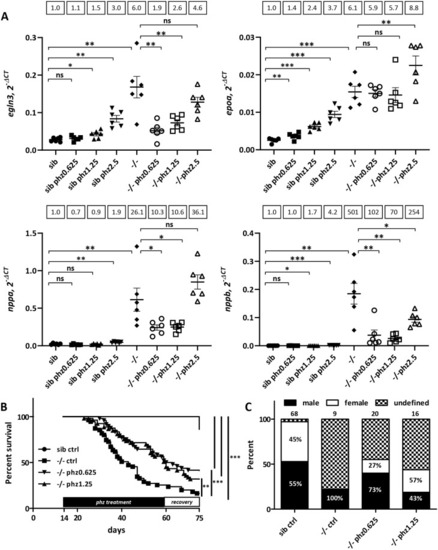
Phenylhydrazine treatment alleviates pathological conditions induced by Endoglin deficiency in zebrafish. (A) RT-qPCR analysis of egln3, epoa and nppa and nppb expression in 27 dpf sibling and eng−/− fish untreated or treated with 0.625, 1.25 and 2.5 µg/ml phenylhydrazine (phz). Target gene expression is represented as 2−ΔCT using rpl13a as reference. Samples (n=6) are pools of four fish. Data are presented as individual values and mean±s.e.m. Mean fold change using sib as reference is indicated above graphs. egln3: sib versus sib phz 0.625 µg/ml (phz0.625), P=0.1178; sib versus sib phz 1.25 µg/ml (phz1.25), *P=0.0104; sib versus sib phz 2.5 µg/ml (phz2.5), **P=0.0019; sib control (ctrl) versus −/− ctrl, **P=0.0037; −/− ctrl versus −/− phz0.625, **P=0.005; −/− ctrl versus −/− phz1.25, P=0.0103; −/− ctrl versus −/− phz2.5, P=0.0814. epoa: sib versus sib phz0.625, **P=0.0068; sib versus sib phz1.25, ***P<0.0001; sib versus sib phz2.5, ***P=0.0003; sib ctrl versus −/− ctrl, ***P=0.0003; −/− ctrl versus −/− phz0.625, P=0.1573; −/− ctrl versus −/− phz1.25, P=0.1489; −/− ctrl versus −/− phz2.5, **P=0.0094. nppa: sib versus sib phz0.625, P=0.0525; sib versus sib phz1.25, P=0.1850; sib versus sib phz2.5, **P=0.0014; sib ctrl versus −/− ctrl, **P=0.0045; −/− ctrl versus −/− phz0.625, *P=0.0204; −/− ctrl versus −/− phz1.25, *P=0.0206; −/− ctrl versus −/− phz2.5, P=0.0675. nppb: sib versus sib phz0.625, P=0.3146; sib versus sib phz1.25, *P=0.0417; sib versus sib phz2.5, ***P=0.0005; sib ctrl versus −/− ctrl, **P=0.0032; −/− ctrl versus −/− phz0.625, **P=0.0043; −/− ctrl versus −/− phz1.25, **P=0.0042; −/− ctrl versus −/− phz2.5, *P=0.0259. ns, not significant. Shown are false discovery rate (FDR)-adjusted P-values from Brown–Forsythe test and Welch's test, and two-stage linear set-up procedure of Benjamini, Krieger and Yekutieli posthoc test for multiple comparisons after assessment of normal distribution and equal s.d. (B) Phz treatment enhances eng−/− survival. Kaplan–Meier representation of the survival of sibling and eng−/− fish non-treated (ctrl) or treated with phz at 0.625 or 1.25 µg/ml. sib versus −/− ctrl or −/−phz1.25 or −/−phz0.625, ***P<0.0001; −/− versus −/− phz1.25, **P=0.0039; −/− versus −/− phz0.625, ***P=0.0009 [log-rank (Mantel–Cox) test]. sib ctrl, n=66; −/− ctrl, n=55; −/−phz1.25, n=53; −/−phz0.625, n=48. (C) Influence of phz treatment on sex ratio in individuals aged 2.5 months and above. Graph represents the percentage of fish reaching adulthood. Analyzed fish numbers are indicated above bars. Male and female values are indicated inside bars.
|
