FIGURE

Fig. 4

ID
ZDB-FIG-230605-20
Publication
Lumaquin-Yin et al., 2023 - Lipid droplets are a metabolic vulnerability in melanoma
Other Figures
All Figure Page
Back to All Figure Page
Fig. 4

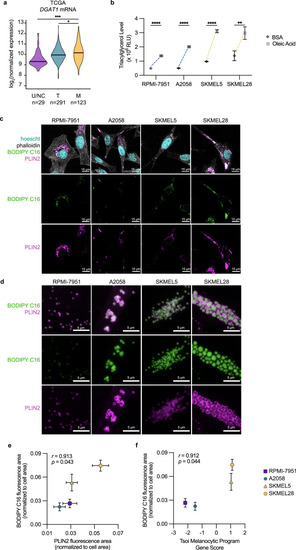
Melanocytic cells increase lipid droplet production.

a TCGA log2 normalized mRNA expression for DGAT1 (Violin plot with bar indicating mean). Statistics via two-sided Wilcoxon rank sum test with Holm correction. * p = 0.03, *** p = 0.0002. b Triacylglycerol levels in melanoma cell lines 24 h after addition of BSA or 100 μM oleic acid (mean ± SEM, n = 12 biologically independent replicates over n = 3 independent experiments). Statistics via two-tailed t-test with Holm-Sidak correction. ** p = 0.009, **** p < 0.0001. c Representative whole cell images of lipid droplets in melanoma cell lines 24 h after BODIPY C16 uptake (n = 3 biologically independent experiments). d Representative higher magnification images of lipid droplets in melanoma cell lines. Plots of (e) PLIN2 to BODIPY C16 fluorescence area and (f) Tsoi Melanocytic Program Gene Score to BODIPY C16 fluorescence area for melanoma cell lines (mean ± SEM, n = 3 biologically independent experiments). Statistics via Pearson correlation with one-tailed t-test.

Expression Data

Expression Detail
Antibody Labeling
Phenotype Data

Phenotype Detail
Acknowledgments
This image is the copyrighted work of the attributed author or publisher, and ZFIN has permission only to display this image to its users. Additional permissions should be obtained from the applicable author or publisher of the image. Full text @ Nat. Commun.