FIGURE SUMMARY
Title

Lipid droplets are a metabolic vulnerability in melanoma

Authors
Lumaquin-Yin, D., Montal, E., Johns, E., Baggiolini, A., Huang, T.H., Ma, Y., LaPlante, C., Suresh, S., Studer, L., White, R.M.
Source
Full text @ Nat. Commun.

Zebrafish melanoma displays distinct transcriptional states where melanocytic cell state upregulates oxidative metabolic pathways.

a Schematic of zebrafish TEAZ. Transgenic casper;mitfa:BRAFV600E;p53−/− zebrafish were injected with tumor-initiating plasmids and electroporated to generate BRAFV600Ep53-/-PTENko melanomas. b UMAP dimensionality reduction plot of melanoma and TME cells. Cell assignments are labeled and colored. c Heatmap of top 15 differentially expressed genes in each melanoma transcriptional cell state. Select genes labeled. d UMAP feature plots showing scaled gene expression of pigmentation genes (tyrp1a, dct, pmela, slc45a2). e Tsoi Melanocytic Program4 module scores for cells in each melanoma cell state. Adjusted p values were calculated using Wilcoxon rank-sum test with Holm correction. **** p < 0.0001. f Top 10 enriched GO Biological Processes in melanocytic cluster filtered by multi-level Monte Carlo with Benjamini-Hochberg adjusted p values < 0.05. Pathways are color-coded based on pigmentation or metabolism-related pathways. Figure 1a was created with BioRender.com.

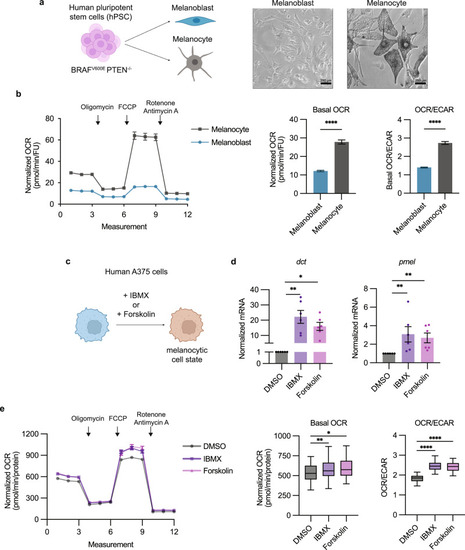
Melanocytic cell state leads to oxidative metabolic rewiring.

a Schematic of hPSC differentiation to melanoblasts and melanocytes. Representative images for cell morphology of melanoblasts and melanocytes. b Normalized OCR measurements for melanoblasts and melanocytes. Basal OCR and OCR/ECAR values derived from measurement 3 (mean ± SEM, melanoblast n = 111 biologically independent replicates, IBMX n = 108 biologically independent replicates over n = 3 biologically independent experiments). Statistics via two-tailed t-test with Welch correction. **** p < 0.0001. c Schematic of inducing melanocytic cell state in human A375 cells via IBMX or Forskolin for 72 h. d qRT-PCR for melanocytic genes dct and pmel in human A375 cells (mean ± SEM, n = 6 biologically independent replicates over n = 3 biologically independent experiments). Statistics via Kruskal Wallis with Dunn’s multiple comparisons test. * p < 0.05, ** p < 0.01. e Normalized OCR measurements for human A375 cells treated with DMSO, IBMX, or Forskolin. Basal OCR and OCR/ECAR values derived from measurement 3 (Tukey’s boxplot center = median, box bounds = 25th and 75th percentile, whiskers = min and max, DMSO n = 55 biologically independent replicates, IBMX n = 56 biologically independent replicates, Forskolin n = 52 biologically independent replicates over n = 3 biologically independent experiments). Statistics via One-way ANOVA with Dunnett’s multiple comparisons test. * p = 0.016, ** p = 0.009, **** p < 0.0001. Figure 2a, c was created with Biorender.com.

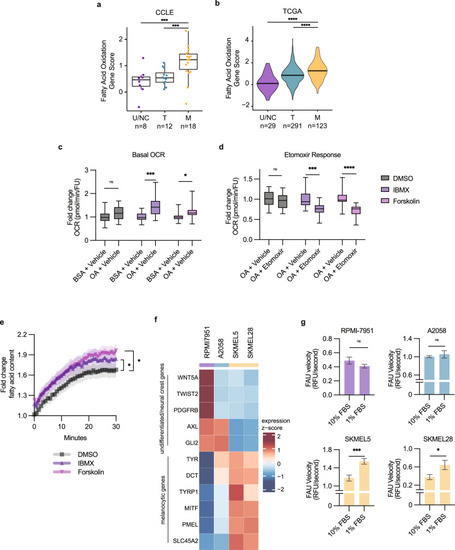
Fatty acids are utilized by melanocytic cells for oxidative metabolism.

Fatty acid oxidation gene score for undifferentiated/neural crest (U/NC), transitory (T), and melanocytic (M) melanomas in the databases from: a CCLE (Tukey’s boxplot center = median, box bounds = 25th and 75th percentile, whiskers = min and max, n = number of independent cell lines) and b TCGA (Violin plot with bar indicating mean, n = number of patient samples). Statistics via two-sided Wilcoxon rank sum test with Holm correction. *** p < 0.001, **** p < 0.0001. Fatty acid oxidation stress test in A375 cells showing fold change normalized OCR: c basal OCR from measurement 3 and d etomoxir response from measurement 9 (Tukey’s boxplot center = median, box bounds = 25th and 75th percentile, whiskers = min and max, n = 3 biologically independent experiments). Statistics via two-tailed t-test with Holm-Sidak correction. * p = 0.013, *** p < 0.001, **** p < 0.0001. e Fold change in fatty acid uptake in drug-treated human A375 cells (mean ± SEM, n = 3 biologically independent experiments). Statistics via area under the curve two-tailed t-test with Holm–Sidak correction. * p < 0.05. f Heatmap of CCLE melanocytic gene expression from RPMI-7951 (U/NC), A2058 (T), SKMEL5 (M), and SKMEL28 (M) cells. g Fatty acid uptake (FAU) velocity from RPMI-7951 (U/NC), A2058 (T), SKMEL5 (M), and SKMEL28 (M) cells (mean ± SEM, n = 13 biologically independent replicates over n = 3 biologically independent experiments). Statistics via two-tailed t-test. * p = 0.03, *** p = 0.0006.

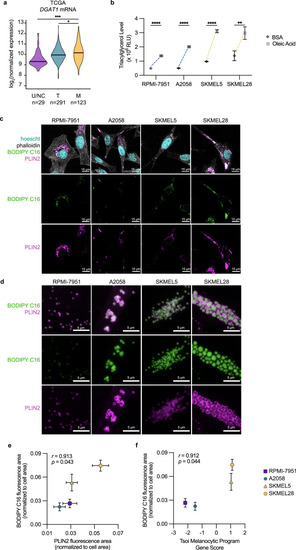
Melanocytic cells increase lipid droplet production.

a TCGA log2 normalized mRNA expression for DGAT1 (Violin plot with bar indicating mean). Statistics via two-sided Wilcoxon rank sum test with Holm correction. * p = 0.03, *** p = 0.0002. b Triacylglycerol levels in melanoma cell lines 24 h after addition of BSA or 100 μM oleic acid (mean ± SEM, n = 12 biologically independent replicates over n = 3 independent experiments). Statistics via two-tailed t-test with Holm-Sidak correction. ** p = 0.009, **** p < 0.0001. c Representative whole cell images of lipid droplets in melanoma cell lines 24 h after BODIPY C16 uptake (n = 3 biologically independent experiments). d Representative higher magnification images of lipid droplets in melanoma cell lines. Plots of (e) PLIN2 to BODIPY C16 fluorescence area and (f) Tsoi Melanocytic Program Gene Score to BODIPY C16 fluorescence area for melanoma cell lines (mean ± SEM, n = 3 biologically independent experiments). Statistics via Pearson correlation with one-tailed t-test.

Knockout of DGAT1 suppresses lipid droplet formation and tumor progression.

a Representative fluorescent images of ZMEL-LD lipid droplets marked by PLIN2-tdTOMATO. Cells were incubated with 100 µM oleic acid for 24 h and lipid droplets were quantified via flow cytometry (mean ± SEM, n = 4 biologically independent experiments). Statistics via two-tailed t-test with Holm-Sidak correction. b Schematic of zebrafish TEAZ. Transgenic casper;mitfa:BRAFV600E;p53−/− zebrafish were injected with tumor-initiating plasmids and electroporated to generate BRAFV600E p53−/− PTENko melanomas with normal or suppressed lipid droplet formation. c Representative images of zebrafish flank with TEAZ-generated tumors. Corresponding quantification of tumor area via image analysis as described in Methods (mean ± SEM, n = 3 biologically independent injections, sgNT n = 45, sgDGAT1a n = 49). Statistics via two-sided Mann-Whitney U test at each time point. d Representative histological images from week 12 TEAZ generated tumors with H&E, BRAFV600E, and PLIN2 staining (n = 4 fish per genotype). Yellow arrows denote punctate PLIN2 staining for lipid droplets. Figure 5b was created with Biorender.com.

Inhibiting lipid droplet formation suppresses tumor growth and cell cycle progression.

a Schematic of zebrafish TEAZ and sort for genomic DNA and mRNA. Transgenic casper;mitfa:BRAFV600E;p53−/− zebrafish were injected with tumor-initiating plasmids and electroporated to generate BRAFV600Ep53−/−PTENko melanomas with normal or suppressed lipid droplet formation. Melanoma cells were sorted to extract genomic DNA and mRNA. b Top 15 most significant (multi-level Monte Carlo by Benjamini-Hochberg adjusted p values) GO Biological Processes positively and negatively enriched in sgDGAT1a tumors. c Schematic of ZMEL-LD blastula transplant assay. d Representative images and tumor area quantification of blastula transplant. (mean ± SEM, DMSO n = 31 biologically independent replicates, 1 µM n = 27 biologically independent replicates, 5 µM n = 19 biologically independent replicates over n = 3 biologically independent experiments). Statistics via Kruskal Wallis with Dunn’s multiple comparison test. **** p < 0.0001. e Relative cell proliferation in RPMI-7951 (U/NC), A2058 (T), SKMEL5 (M), and SKMEL28 (M) treated with indicated DGAT1i inhibitor concentrations in nutrient limited media. (mean ± SEM, RPMI-7951 n = 9 biologically independent replicates, A2058 n = 9 biologically independent replicates, SKMEL5 n = 9 biologically independent replicates, SKMEL28 n = 12 biologically independent replicates over n = 3 biologically independent experiments). Statistics via Kruskal Wallis with Dunn’s multiple comparison test. ** p < 0.01, *** p < 0.001. Figure 6a, c was created with Biorender.com.

Acknowledgments
This image is the copyrighted work of the attributed author or publisher, and ZFIN has permission only to display this image to its users. Additional permissions should be obtained from the applicable author or publisher of the image. Full text @ Nat. Commun.