
Fig 4
- ID
- ZDB-FIG-230519-31
- Publication
- Viana et al., 2023 - Hiding in the yolk: A unique feature of Legionella pneumophila infection of zebrafish
- Other Figures
- All Figure Page
- Back to All Figure Page
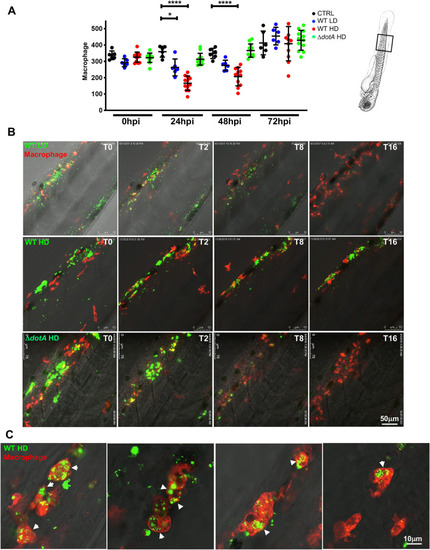
L. pneumophila high dose injection results in (systemic) macrophage and neutrophil death.
A) Macrophage counts of control larvae (black symbols) or upon Low Dose (blue symbols) or High Dose of WT-GFP (red symbols), or High Dose (green symbols) of ΔdotA -GFP injection. The scheme of the zebrafish larvae has been adapted from [35] and has been previously modified from [87]. Macrophages were counted manually from images taken on live infected larvae over time from T0 to T72 hpi, using ImageJ software, and results were plotted using GraphPad Prism software. Mean±SEM are also shown (horizontal bars). Data plotted are from two pooled independent experiments (n = 12 larvae scored for each condition). P < 0.05 was considered statistically significant (symbols: **** P < 0.0001; ***P < 0.001; **P < 0.01; *P < 0.05). No symbol on graphs means that not statistically differences were observed. B) Frames extracted from maximum intensity projection of in vivo time-lapse confocal fluorescence microscopy of 72hpf Tg(mfap4::mCherryF) larvae injected in the bloodstream (iv) with a LD, HD (of WT-GFP or a HD of ΔdotA-GFP (upper panel) or Tg(LysC::DsRed)nz50 in the bloodstream with a LD, HD of WT-GFP or a HD of ΔdotA-GFP (lower panel) to follow macrophage bacteria interaction over time during the first 16 hpi. Overlay of green (L. pneumophila) and red (leucocytes) fluorescence of the caudal area of the larvae (region boxed in the scheme on the right of the panel) is shown. BF helps for anatomical region indication. Representative of n = 12 to 16 injected larvae for each condition. Scale bar: 50μm. See also related S6 Movie. C) macrophage L pneumophila interaction at 72 hpi captured at high resolution upon HD WT injection. Bacteria inside zebrafish macrophages suggesting the establishment of a replicative niche (arrows), as documented for cultured mammalian macrophages or amoebae. Representative of n = 15 scored infected larvae. Overlay of green (GFP bacteria), red (mCherry macrophages) and BF is shown. Scale bar = 10mm. |