
Fig 1
- ID
- ZDB-FIG-230519-28
- Publication
- Viana et al., 2023 - Hiding in the yolk: A unique feature of Legionella pneumophila infection of zebrafish
- Other Figures
- All Figure Page
- Back to All Figure Page
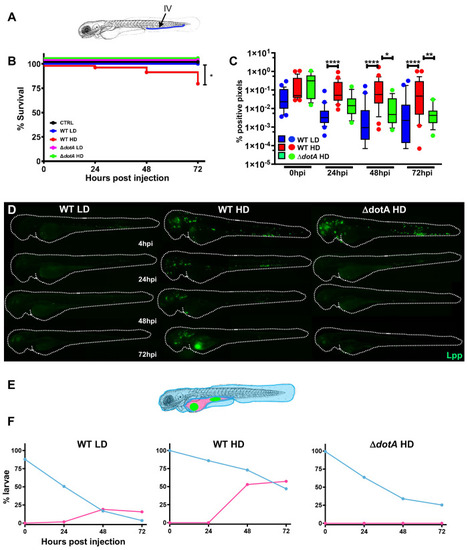
Zebrafish larvae are susceptible to intravenous L. pneumophila infection in a dose dependent manner.
A) Scheme of the experimental set up of bacterial infection using zebrafish. A 72hpf zebrafish larva. Bacteria are injected in the bloodstream (iv) via the caudal vein (green arrow). The scheme of the zebrafish larvae has been adapted from [35] and has been previously modified from [87] B) Survival curves (three independent experiments pooled) of zebrafish larvae injected with WT-GFP Low Dose (WT LD) (blue curve, n = 60) or High Dose (HD) (red curve, n = 60), or with ΔdotA-GFP Low Dose (ΔdotA LD) (green curve, n = 12) or High Dose (ΔdotA HD) (green curve, n = 36), and incubated at 28°C. Control non-injected fish (CTRL, black curve; n = 72). P < 0.05 was considered statistically significant (symbols: **** P < 0.0001; ***P < 0.001; **P < 0.01; *P < 0.05. C) Bacterial burden evaluation by quantification of % of fluorescent pixel counts from images of individual injected larvae followed over time from 0 to 72 hpi. Each larva was imaged daily, and images were analysed with Fiji for bacterial burden quantification. Five experiments have been pooled, for a total of 28 larvae for WT LD and LD, 18 for ΔdotA HD. P < 0.05 was considered statistically significant (symbols: **** P < 0.0001; ***P < 0.001; **P < 0.01; *P < 0.05. No symbol on graphs means that not statistically differences were observed. D) Representative images of L. pneumophila dissemination, determined by live imaging using a fluorescence stereomicroscope, of zebrafish AB larvae infected with a LD or a HD of WT-GFP, or a HD of ΔdotA-GFP. Individual infected larvae were followed over time by live imaging at 4h, 24h, 48h, and 72h post injection. GFP fluorescence of the injected bacteria is shown. E) Scheme of a 72 hpi larva with body (light blue) and yolk (pink) region highlighted. Green dot in the yolk represents bacteria burden. The scheme of the zebrafish larvae has been adapted from [35] and has been previously modified from [87]. F) Quantification of bacterial dissemination over time. Larvae injected with LD, HD LD or ΔdotA HD were imaged over time, and then scored for the GFP + bacteria absolute presence for each larva over time. Larvae were scored as “infected” when they showed at least one small detectable GFP+ dot. Data obtained were plotted as % of larvae with bacteria in the body (tail, trunk, head; blue curve), or in the yolk (pink curve). 11 independent experiments have been plotted (representing a total of n = 69 WT LD; n = 58 WT HD; n = 54 ΔdotA HD infected larvae). |