
Fig. 2
- ID
- ZDB-FIG-230511-40
- Publication
- Alexander et al., 2022 - Optic flow in the natural habitats of zebrafish supports spatial biases in visual self-motion estimation
- Other Figures
- All Figure Page
- Back to All Figure Page
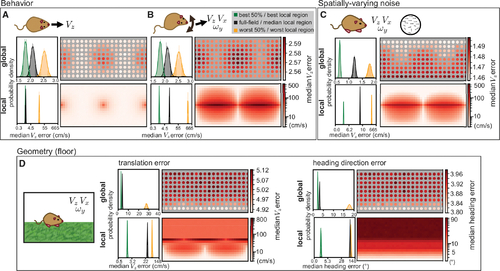
Animal behavior and environment shape spatial biases
(A) An animal only moving forward removes the ambiguity in local flow templates so that both global and local errors indicate an away-from-foci advantage. Histograms on the left indicate the distribution of median absolute self-motion estimation errors for the best 50%, worst 50%, and full field global samples at matched resolution, and the best, worst, and median local regions over 1,000 simulations of 1,000 self-motion trajectories. Heatmaps indicating median errors are plotted in the same format as Figure 1. All model parameters are the same as Figure 1, except self-motion components other than VZ were all set to zero and a 1 DOF estimation applied. For the local optic flow, both the best and median regions are associated with very low error, resulting in a high degree of histogram overlap. (B) An animal translating and rotating in a plane sees higher errors and expanded regions of ambiguity. All model parameters are the same as Figure 1, except self-motion components other than VZ, VX, and ωY were all set to zero and a 3 DOF estimation applied. (C) When noise varies linearly from none at 90° elevation to a maximum at −90° elevation, low error regions are shifted upward. All model parameters are otherwise the same as (B), and maximum noise had a standard deviation of 0.25 (relative to a maximal per-component flow magnitude of 1). (D) When the environment is a floor plane rather than a sphere, VZ error explodes at and above the equator. Heading estimates remove the depth ambiguity in translation component magnitude by comparing VX and VZ estimates, eliminating azimuth dependence for a pure lower field bias. All model parameters are the same as (B) except for the scene geometry, which is modeled as a flat floor 1m below and an infinitely far away wall in the upper visual field. Note that histograms and heatmaps for local errors in this figure are all on a log scale to account for the larger variability associated with different environmental settings. |