
Fig. 4
- ID
- ZDB-FIG-230505-15
- Publication
- Narumi et al., 2022 - GWAS of thyroid dysgenesis identifies a risk locus at 2q33.3 linked to regulation of Wnt signaling
- Other Figures
- All Figure Page
- Back to All Figure Page
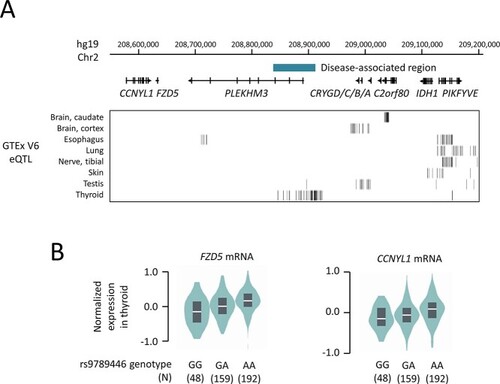
Summary of eQTL analysis in the 2q33.3 locus. (A) The upper panel shows an overview of the 72-kb TD-associated region and adjacent regions. In the lower panel, statistically significant eQTLs (observed in 8 organs) registered in the GTEx V6 database are indicated by bars. No eQTL was observed in this region for 36 other organs, and these organs were omitted from this figure. Note that eQTLs located in the 72-kb locus were detected only in thyroid. (B) The allelic effect of rs9789446 on thyroid expression levels of FZD5 and CCNYL1 are shown by boxplots within violin plots. The data were obtained from the GTEx V6 dataset. Violin plot shows the density plot of the data on each side; the lower and upper borders of the box correspond to the first and third quartiles, respectively; the central line indicates the median. |