
- Title
-
GWAS of thyroid dysgenesis identifies a risk locus at 2q33.3 linked to regulation of Wnt signaling
- Authors
- Narumi, S., Opitz, R., Nagasaki, K., Muroya, K., Asakura, Y., Adachi, M., Abe, K., Sugisawa, C., Kühnen, P., Ishii, T., Nöthen, M.M., Krude, H., Hasegawa, T.
- Source
- Full text @ Hum. Mol. Genet.
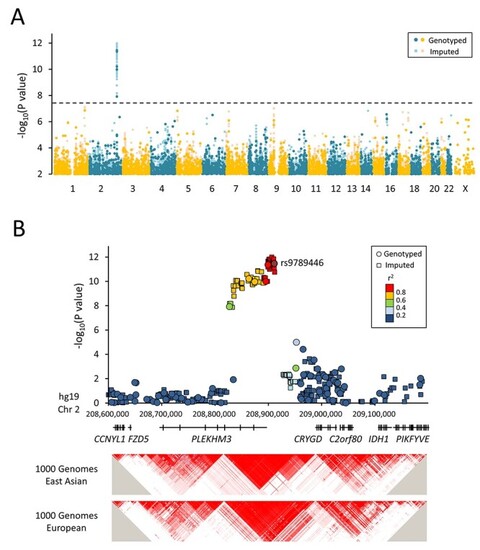
Identification of the TD-associated risk locus at 2q33.3. (A) Manhattan plot of the χ2 test P values of GWAS. A broken line indicates the genome-wide threshold for significance (5 × 10⁻⁸). Genotyped SNPs and imputed SNPs are plotted according to the chromosomal locations with the –log10(P values) from the GWAS. (B) The upper panel shows a zoomed image of the region in chromosome 2 (hg19; chr2:208600001-209200000), showing a significant association in GWAS. Genotyped SNPs (circles) along with imputed SNPs (boxes) are shown. The lower panels display the linkage disequilibrium blocks in the 1000 Genomes project data (East Asian and European). |

Subgroup analysis based on thyroid morphology. The forest plot shows associations of rs9789446 with TD, expressed as per-allele OR, across three subgroups defined by thyroid morphology (thyroid aplasia, hypoplasia and ectopia). The number of German subjects with ectopia was so small (N = 6) that calculation of OR was not applicable (NA). Boxes represent point estimates of effect. Lines represent 95% confidence interval. |

Summary of gene regulation analyses in the 2q33.3 locus. The upper panel shows an overview of the 72-kb TD-associated region. Data of (i) histone modifications (H3K27ac and H3K4me1), (ii) the assay for transposase-accessible chromatin with high-throughput sequencing (ATAC-seq), which are associated with enhancer activity, (iii) capture Hi-C, visualizing long-range interactions involving promoters of FZD5 (blue) and CCNYL1 (red) and (iv) RNA expression are visualized. |
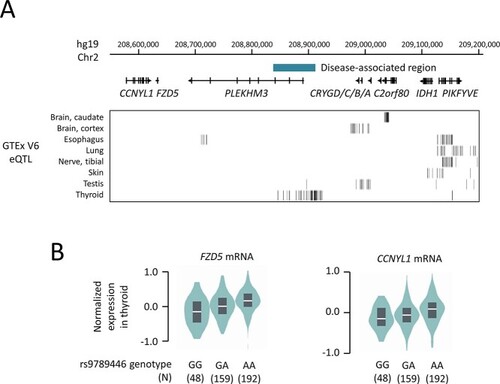
Summary of eQTL analysis in the 2q33.3 locus. (A) The upper panel shows an overview of the 72-kb TD-associated region and adjacent regions. In the lower panel, statistically significant eQTLs (observed in 8 organs) registered in the GTEx V6 database are indicated by bars. No eQTL was observed in this region for 36 other organs, and these organs were omitted from this figure. Note that eQTLs located in the 72-kb locus were detected only in thyroid. (B) The allelic effect of rs9789446 on thyroid expression levels of FZD5 and CCNYL1 are shown by boxplots within violin plots. The data were obtained from the GTEx V6 dataset. Violin plot shows the density plot of the data on each side; the lower and upper borders of the box correspond to the first and third quartiles, respectively; the central line indicates the median. |