
Figure 3
- ID
- ZDB-FIG-230427-9
- Publication
- Hasegawa et al., 2023 - Comparison of Pronase versus Manual Dechorionation of Zebrafish Embryos for Small Molecule Treatments
- Other Figures
- All Figure Page
- Back to All Figure Page
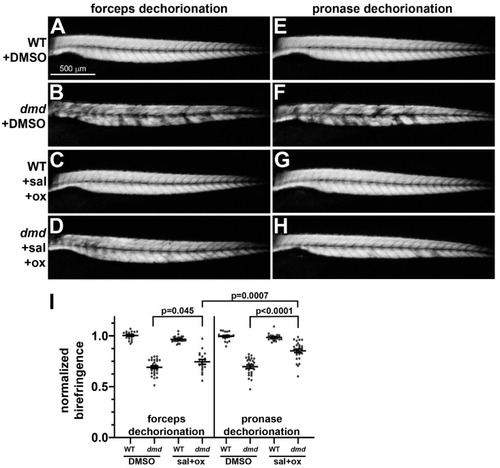
Muscle birefringence of salermide + oxamflatin-treated zebrafish larvae following manual or pronase dechorionation. (A–H) Zebrafish trunk skeletal muscle birefringence at 4 dpf. Lateral views, anterior to the left. Images show (A,E) dmd+/+ wild-type (WT) + DMSO, (B,F) dmd+/+ WT + salermide+oxamflatin, (C,G) dmd−/− (dmd) + DMSO, and (D,H) dmd−/− (dmd) + salermide+oxamflatin. (I) Graph of average normalized birefringence pixel intensities (mean grey values) in WT (dmd+/+) and dmd (dmd−/−) zebrafish larvae treated with DMSO (control) or salermide + oxamflatin and dechorionated with forceps (left) or pronase (right). Horizontal lines represent the mean and standard error of the mean. Each dot represents an individual embryo (n = 18–28 animals per condition). Mean gray values between dmd DMSO and dmd salermide + oxamflatin animals were significantly different for each dechorionation condition. Mean grey values for dmd salermide + oxamflatin pronase-dechorionated animals were significantly higher than those for dmd salermide + oxamflatin forceps-dechorionated animals. Error bars represent the standard error. Significance was determined using a one-way ANOVA test comparing each treatment group to the dmd DMSO control group with Dunnett’s correction for multiple comparisons. Data in support of (I) is available in Table S2 in Supplementary Materials. |