
FIGURE
Figure 3
Figure 3
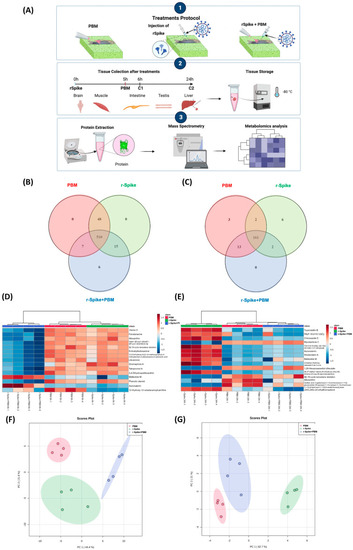
Metabolomics experimental protocol and unsupervised data analysis. (A) Venn diagram of the features distributed among each group of the 6 h treatment; (B) Venn diagram of the features distributed among each group of the 24 h treatment; (C) Heatmap of the top-15 most relevant features according to ANOVA of the 6 h samples; (D) Heatmap of the top-15 most important features according to the VIP score of the 24 h samples; (E) PCA of the 6 h groups; (F) PCA of the 24 h groups; (G) impacted metabolic pathways. |
Expression Data
Expression Detail
Antibody Labeling
Phenotype Data
Phenotype Detail
Acknowledgments
This image is the copyrighted work of the attributed author or publisher, and
ZFIN has permission only to display this image to its users.
Additional permissions should be obtained from the applicable author or publisher of the image.
Full text @ Int. J. Mol. Sci.