
- Title
-
Photobiomodulation Reduces the Cytokine Storm Syndrome Associated with COVID-19 in the Zebrafish Model
- Authors
- Rosa, I.F., Peçanha, A.P.B., Carvalho, T.R.B., Alexandre, L.S., Ferreira, V.G., Doretto, L.B., Souza, B.M., Nakajima, R.T., da Silva, P., Barbosa, A.P., Gomes-de-Pontes, L., Bomfim, C.G., Machado-Santelli, G.M., Condino-Neto, A., Guzzo, C.R., Peron, J.P.S., Andrade-Silva, M., Câmara, N.O.S., Garnique, A.M.B., Medeiros, R.J., Ferraris, F.K., Barcellos, L.J.G., Correia-Junior, J.D., Galindo-Villegas, J., Machado, M.F.R., Castoldi, A., Oliveira, S.L., Costa, C.C., Belo, M.A.A., Galdino, G., Sgro, G.G., Bueno, N.F., Eto, S.F., Veras, F.P., Fernandes, B.H.V., Sanches, P.R.S., Cilli, E.M., Malafaia, G., Nóbrega, R.H., Garcez, A.S., Carrilho, E., Charlie-Silva, I.
- Source
- Full text @ Int. J. Mol. Sci.
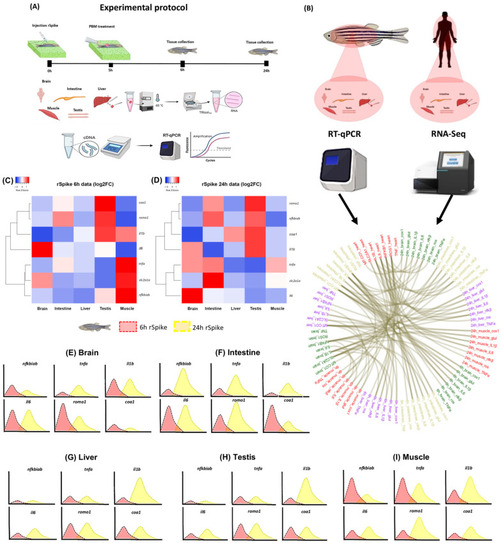
Overview of the transcriptional signature of COVID-19-associated cytokine storm syndrome in a zebrafish model. (A) Experimental protocol; (B) Chord diagram of the transcriptional signature and evolution of fold-change in the rSpike group in different tissue with the comparison of RNA-seq expression analysis in human tissue with COVID-19 (n = 30) versus without COVID-19 (n = 36) (from data set); (C) Heatmap illustrating the fold-change of relative expression levels of related genes in the brain, intestine, liver, testis, and muscle treated with rSpike at 6 h; (D) Heatmap illustrating the fold-change of relative expression levels of related genes in the brain, intestine, liver, testis, and muscle treated with rSpike at 24 h; Curve chart illustrating the relative expression levels of genes in (E) the brain, (F) intestine, (G) liver, (H) testis, and (I) muscle. The x-axis represents the different times (red 6 h and yellow 24 h), and the y-axis represents each gene’s relative expression. |
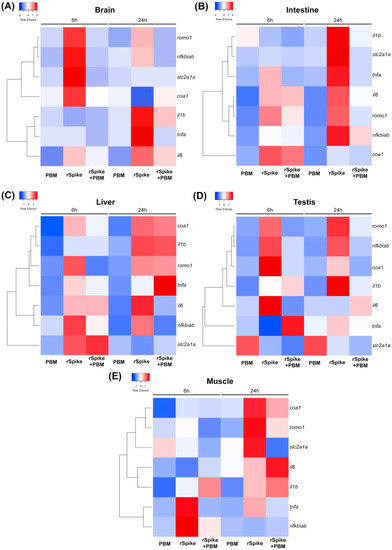
PBM with low-level laser as a potential therapeutic in pathologies originating from SARS-COV-2. Different tissue in (A) the brain, (B) intestine, (C) liver, (D) testis, and (E) muscle of zebrafish males, subjected to low-level laser (6 h and 24 h); injected with recombinant Spike protein (rSpike) and subsequently subjected to PBM (6 h and 24 h). Each colored cell on the map represents the normalized relative gene expression value for each treatment and sample. In each heat map, genes (rows) are grouped hierarchically using Pearson’s correlation as the distance metric. |
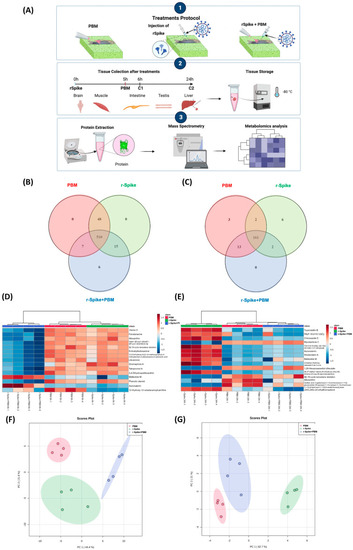
Metabolomics experimental protocol and unsupervised data analysis. (A) Venn diagram of the features distributed among each group of the 6 h treatment; (B) Venn diagram of the features distributed among each group of the 24 h treatment; (C) Heatmap of the top-15 most relevant features according to ANOVA of the 6 h samples; (D) Heatmap of the top-15 most important features according to the VIP score of the 24 h samples; (E) PCA of the 6 h groups; (F) PCA of the 24 h groups; (G) impacted metabolic pathways. |
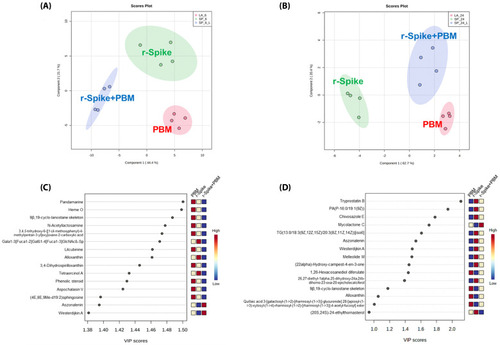
Supervised data analysis from metabolomics data to differentiate the PBM, rSpike, and (rSpike + laser) groups. (A) PLS-DA of the 6 h groups; (B) PLS-DA of the 24 h groups; (C) Variable importance for the projection (VIP) graph for the 6 h groups’ comparison; (D) VIP graph for the 24 h groups’ comparison. |
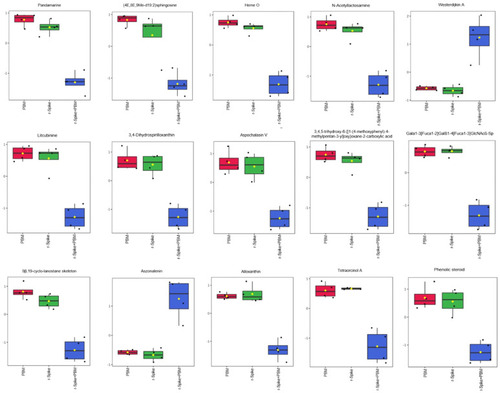
Boxplot plots of the most critical metabolites to differentiate the PBM, rSpike, and (rSpike + laser) after 6 h of treatment. Boxplot graphs referring to the 15 primary metabolites differentially expressed between groups after 6 h of treatment. |

Boxplot plots of the most critical metabolites to differentiate the PBM, rSpike, and (rSpike + laser) after 24 h of treatment. Boxplot plots refer to the 15 primary metabolites expression between groups after 24 h of treatment. |
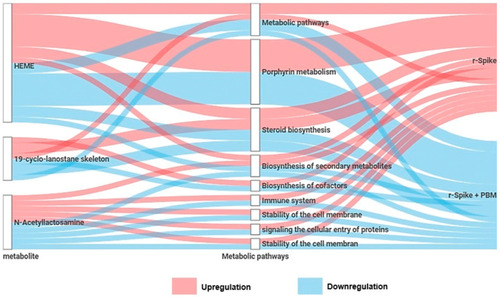
Summary of the metabolites and metabolic pathways differentially expressed between the recombinant Spike protein (rSpike) and PBM treatment. |
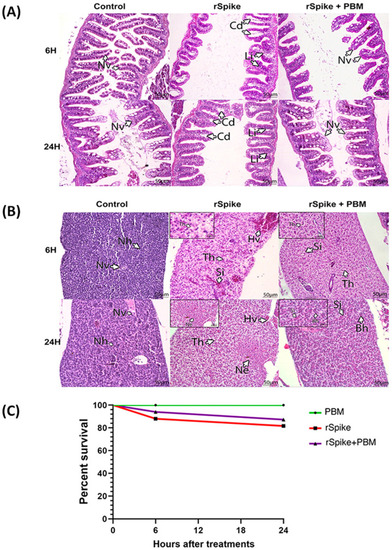
Characterization of acute tissue inflammation induced by rSpike in zebrafish male adults. Histopathological analysis of intestine (A) and liver (B) of zebrafish injected with recombinant Spike protein (rSpike) and PBM. The evaluations occurred after 6 and 24 h. All sections were stained with Hematoxylin and Eosin. Scale: 40 μm. Arrows indicate Nv: Normal villi; Cd: dilated vasa chylifer; Li: lymphocytes, Nh: normal hepatocytes; Hv: hyperemia of vessels; Th: turgid hepatocytes; Si: sinusoids; Ne: necrosis; Bh: basophil hepatocytes. (C) Cumulative Kaplan–Meier probability curve indicating the survival rate of zebrafish males submitted to different treatments: PBM (control), injected with recombinant Spike protein (rSpike), and (rSpike + PBM). |
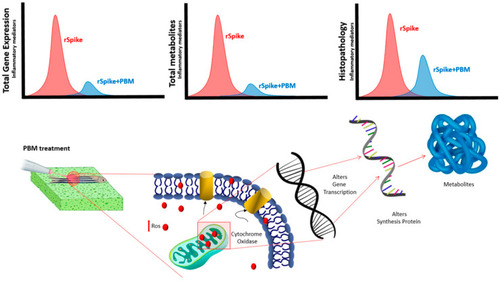
Summary of the effects of recombinant Spike protein (rSpike) and PBM treatment in gene expression, metabolites and histopathology. Analyses were performed using bioassays at 6 and 24 h after treatments. |