
FIGURE 2
- ID
- ZDB-FIG-230331-53
- Publication
- Raterman et al., 2023 - Disruption of the foxe1 gene in zebrafish reveals conserved functions in development of the craniofacial skeleton and the thyroid
- Other Figures
- All Figure Page
- Back to All Figure Page
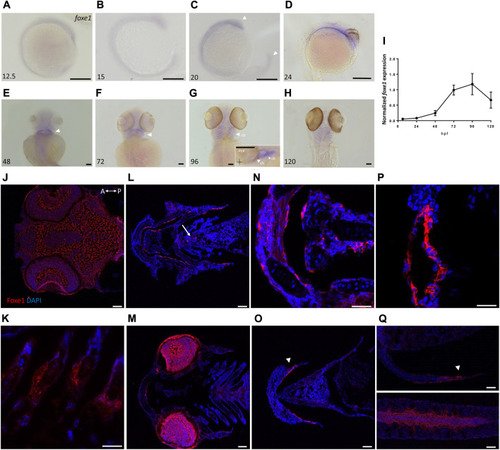
Foxe1 is expressed in a range of larval tissues, including the oral epithelium, ethmoid plate, and the brain. (A–H) foxe1 transcripts were detected diffusely throughout the embryo from early development at 12.5 hpf (A) which continued through early larval stages (B–D) where transcripts also seemed specifically upregulated in the subpharyngeal area (E, F) before being enhanced in the ceratobranchials and ceratohyal ((G), insert lateral view). (A-D) lateral view and (E-H) ventral view. (I) Normalized relative expression of foxe1 during embryonic and larval stages as determined by qPCR. Error bars indicate standard deviations. (J-Q) Detailed protein localization at 96 hpf showed Foxe1-positive cells in the brain (J), the ceratobranchials (K), in the oral epithelium and in a linear cluster in the subpharyngeal area (white arrow) (L), the eyes (M), on the ethmoid plate (N), on the lining of the ceratohyal (O), in the mouth opening (P) and to some extent in the fin tips (Q), upper image) and in the notochordal sheath ((Q), lower image). Posterior-anterior axis in J applies to all images. cb: ceratobranchals, ch: ceratohyal. A-H scalebar 100 μm, (J-Q) scalebar 50 µm. Antibody validation in Supplementary Figure S1. |
| Gene: | |
|---|---|
| Antibody: | |
| Fish: | |
| Anatomical Terms: | |
| Stage Range: | 5-9 somites to Day 5 |