
- Title
-
Disruption of the foxe1 gene in zebrafish reveals conserved functions in development of the craniofacial skeleton and the thyroid
- Authors
- Raterman, S.T., Von Den Hoff, J.W., Dijkstra, S., De Vriend, C., Te Morsche, T., Broekman, S., Zethof, J., De Vrieze, E., Wagener, F.A.D.T.G., Metz, J.R.
- Source
- Full text @ Front Cell Dev Biol
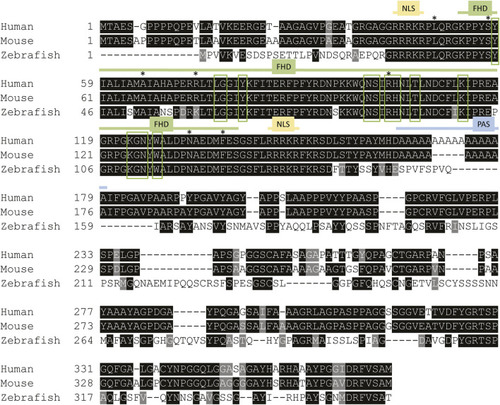
Foxe1 protein structure in human, mouse and zebrafish. Multiple sequence alignment of full-length human, mouse and zebrafish FOXE1 protein. The protein contains three characterized domains which are annotated with colored lines. The similarity of the Forkhead domain (FHD) is 97% and 100%, respectively, between zebrafish and humans and between mouse and human. The sequence similarity of the whole protein between human and zebrafish is 54%. NLS is 100% identical between all species and the poly alanine stretch (PAS) is only present in humans and mouse. Red boxes mark the putative DNA-binding residues and asterisks (*) mark locations of missense mutations that were reported in individuals with Bamforth–Lazarus syndrome ( |
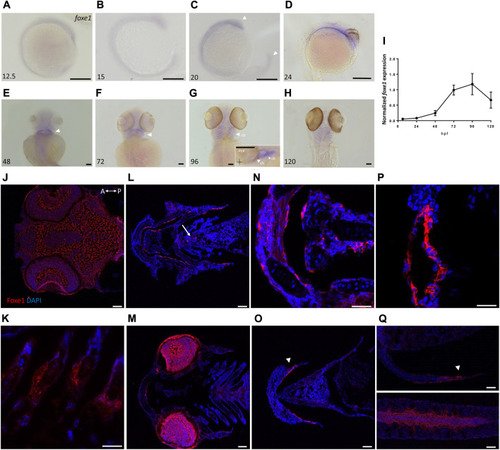
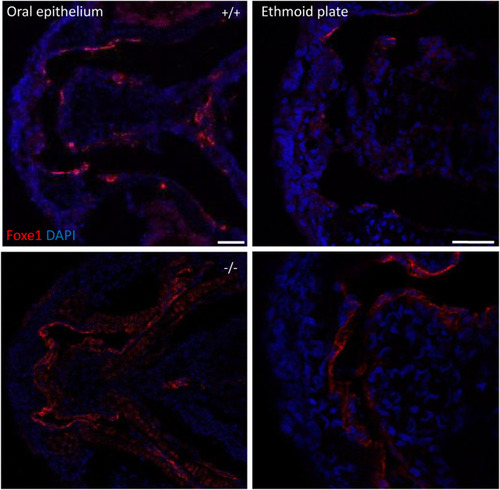
Foxe1 is expressed in a range of larval tissues, including the oral epithelium, ethmoid plate, and the brain. (A–H) foxe1 transcripts were detected diffusely throughout the embryo from early development at 12.5 hpf (A) which continued through early larval stages (B–D) where transcripts also seemed specifically upregulated in the subpharyngeal area (E, F) before being enhanced in the ceratobranchials and ceratohyal ((G), insert lateral view). (A-D) lateral view and (E-H) ventral view. (I) Normalized relative expression of foxe1 during embryonic and larval stages as determined by qPCR. Error bars indicate standard deviations. (J-Q) Detailed protein localization at 96 hpf showed Foxe1-positive cells in the brain (J), the ceratobranchials (K), in the oral epithelium and in a linear cluster in the subpharyngeal area (white arrow) (L), the eyes (M), on the ethmoid plate (N), on the lining of the ceratohyal (O), in the mouth opening (P) and to some extent in the fin tips (Q), upper image) and in the notochordal sheath ((Q), lower image). Posterior-anterior axis in J applies to all images. cb: ceratobranchals, ch: ceratohyal. A-H scalebar 100 μm, (J-Q) scalebar 50 µm. Antibody validation in Supplementary Figure S1. EXPRESSION / LABELING:
|

Foxe1 and T4 are colocalized in the subpharyngeal area. Foxe1 and T4 staining on adjacent coronal sections of the subpharyngeal area of the larval head. T4 and Foxe1 staining in the developing thyroid follicles at 96 hpf. Nuclear counterstain with DAPI. cb; ceratobranchials, e; eye. Scale bar 200 µm. EXPRESSION / LABELING:
|
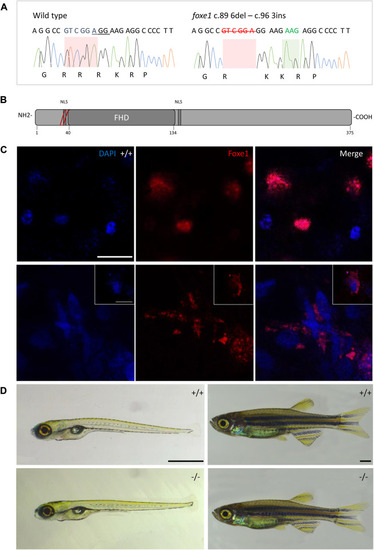
The foxe1 rdb2 mutant. (A) Wild type and foxe1 rdb2 mutant DNA sequence at (C) 84–105. The protospacer adjacent motif is underlined (full gRNA sequence: 5′-GCCGCAAAGAGGCCGTCGGAGG-3′). The deletion is highlighted in red and the insertion in green. (B) Schematic representation of the zebrafish Foxe1 protein and the position of the amino acid changes as indicated by the red bars. (C) Nuclear localization of wild type Foxe1 and cytoplasmatic localization of mutant Foxe1 in zebrafish keratinocytes on scale. Scale bar 50 µm. (D) Representative images of wild types and foxe1 mutants at 6 dpf and 2 months post fertilization. Scale bars 1 mm. EXPRESSION / LABELING:
PHENOTYPE:
|
|

Thyroid follicle development in foxe1 mutants. (A) Normalized gene-expression of thyroid marker thyroglobulin during early development (3 dpf). (B, D) Analysis of T4 positive follicles by whole mount immunohistochemistry in 6 dpf larvae showed no difference in mean follicle count or volume. (C) Representative images of wild type and mutant thyroid follicles. Larvae were imaged from the ventral side and T4-positive follicle surfaces were rendered from z-stack images using Imaris 9.0 as previously described (Zhang et al., 2021). Scale bar 200 µm. (D) Data were assessed for normality with the D’Agostino-Pearson normality test. Normally distributed data were analyzed for statistical differences using a one-way ANOVA and post hoc Tukey test or unpaired t-test. Non-parametric data were compared with a Kruskal–Wallis test with post hoc Dunn’s Multiple comparison test or Mann-Whitney test. Error bars indicate standard deviation. EXPRESSION / LABELING:
PHENOTYPE:
|

Malformed ceratohyal cartilage and reduced content of Ca, Mg and P in foxe1 mutants. (A) Representative images of wild types and foxe1 heterozygous- and homozygous mutants, ventral and lateral view. (B) High magnification images of ceratohyal phenotype. (B′) Col2a1a positive cells in the in ceratohyal. (C) Standard length at 8 dpf. (D) Count of mineralized vertebrae in foxe1 mutants versus wild types at 8 dpf. (E–G) Molar calcium, magnesium and phosphorus content in foxe1 mutants versus wild type larvae during early skeletal development three to 8 dpf. n = 10–33. Scale bar 200 µm. Data were assessed for normality with the D’Agostino-Pearson normality test. Normally distributed data were analyzed for statistical differences using a one-way ANOVA and post-hoc Tukey test or unpaired t-test. Non-parametric data were compared with a Kruskal–Wallis test with post-hoc Dunn’s Multiple comparison test or Mann-Whitney test. Error bars indicate standard deviation. EXPRESSION / LABELING:
PHENOTYPE:
|
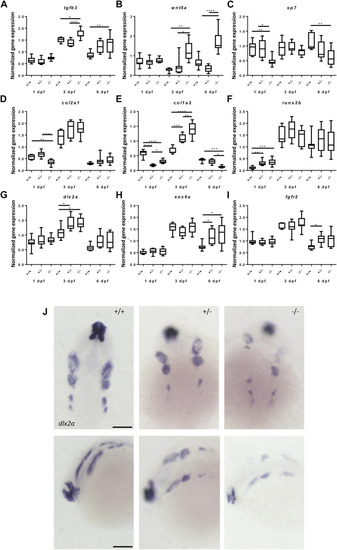
Gene expression of cartilage and bone (precursor) cells is affected in foxe1 mutants. (A-I) Relative gene expression of tgfβ3, wnt5a, sp7, col2a1, col1a2, runx2b, dlx2a, sox9a and fgfr2 in mutants versus wild types. Axis description from (A) applies to all graphs. (J) dlx2a positive post migratory neural crest cells at 24 hpf (Prim-5) in wild types, 20% of the heterozygous- and 60% of the homozygous mutants. Asterisks indicate the level of significance: * = p< 0.05, ** = p< 0.01, *** = p< 0.001, **** = p< 0.0001 (n = 10–15). Data were assessed for normality with the D’Agostino-Pearson normality test. Normally distributed data were analyzed using a one-way ANOVA and post-hoc Tukey test. Non-parametric data were compared with a Kruskal–Wallis test with post-hoc Dunn’s Multiple comparison test. Error bars indicate standard deviation. Scale bar 100 µm. |